Introduction to Memory Analysis with Mandiant Redline
In a previous diary I talked about memory acqusition with Dumpit .in this diary I will talk about how to use Mandiant Redline to analysis the memory dump.[1]
Mandiant Redline:
“Redline, Mandiant’s premier free tool, provides host investigative capabilities to users to find signs of malicious activity through memory and file analysis, and the development of a threat assessment profile”.[2]
Installation:
1-Download Mandiant Redline from https://www.mandiant.com/resources/download/redline
2-Double click on Redline-1.11.msi
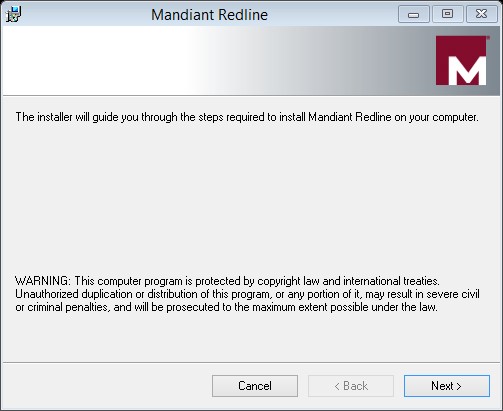
3-follow up the steps, then click close
Redline Usage:
To analysis a memory image :
1-Select From a Saved Memory File under Analyze Data on the home screen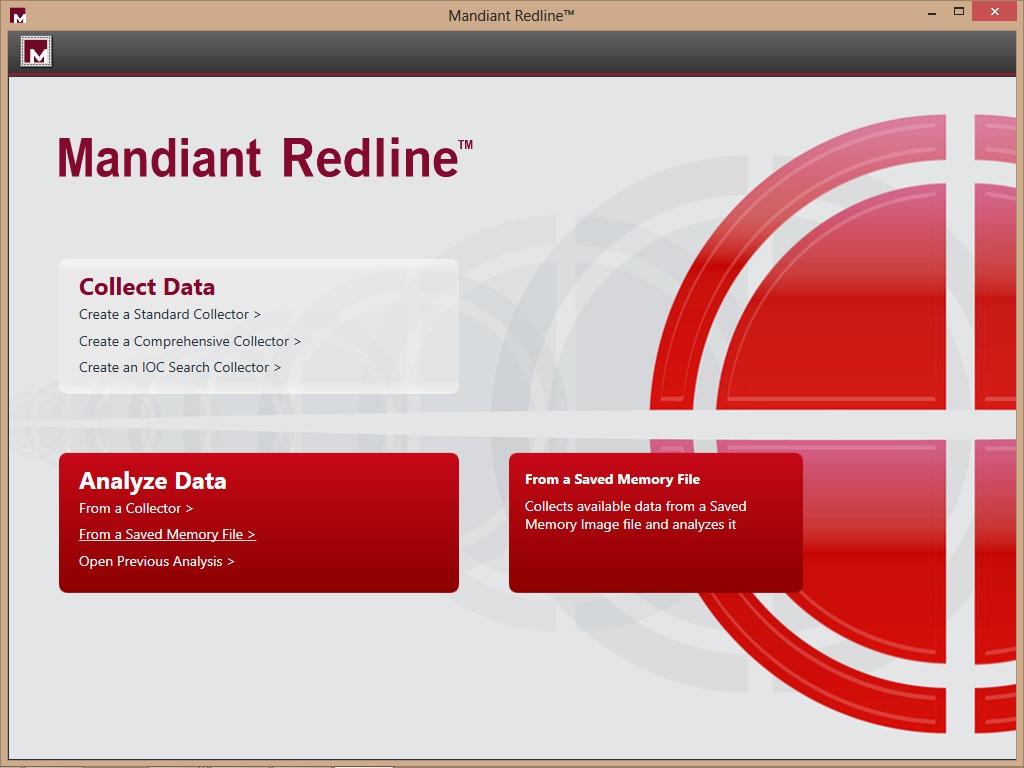
2-Click Browse under Location of Saved Memory Image (for this diary I will not use an Indicators of Comporomise)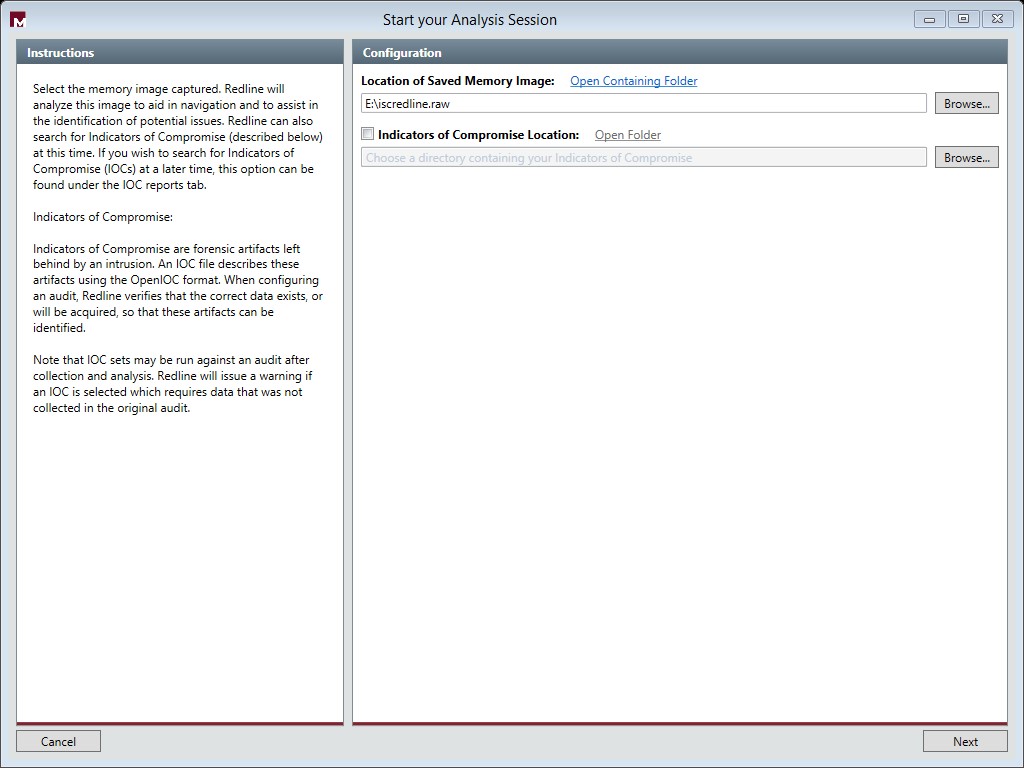
3-Click Next then OK
Depending on the size of the image and the speed of your PC, Mandiant Redline will take time to process the memory image.
4-For this example I am going to choose “I am reviewing A Full Live Response or Memory Image”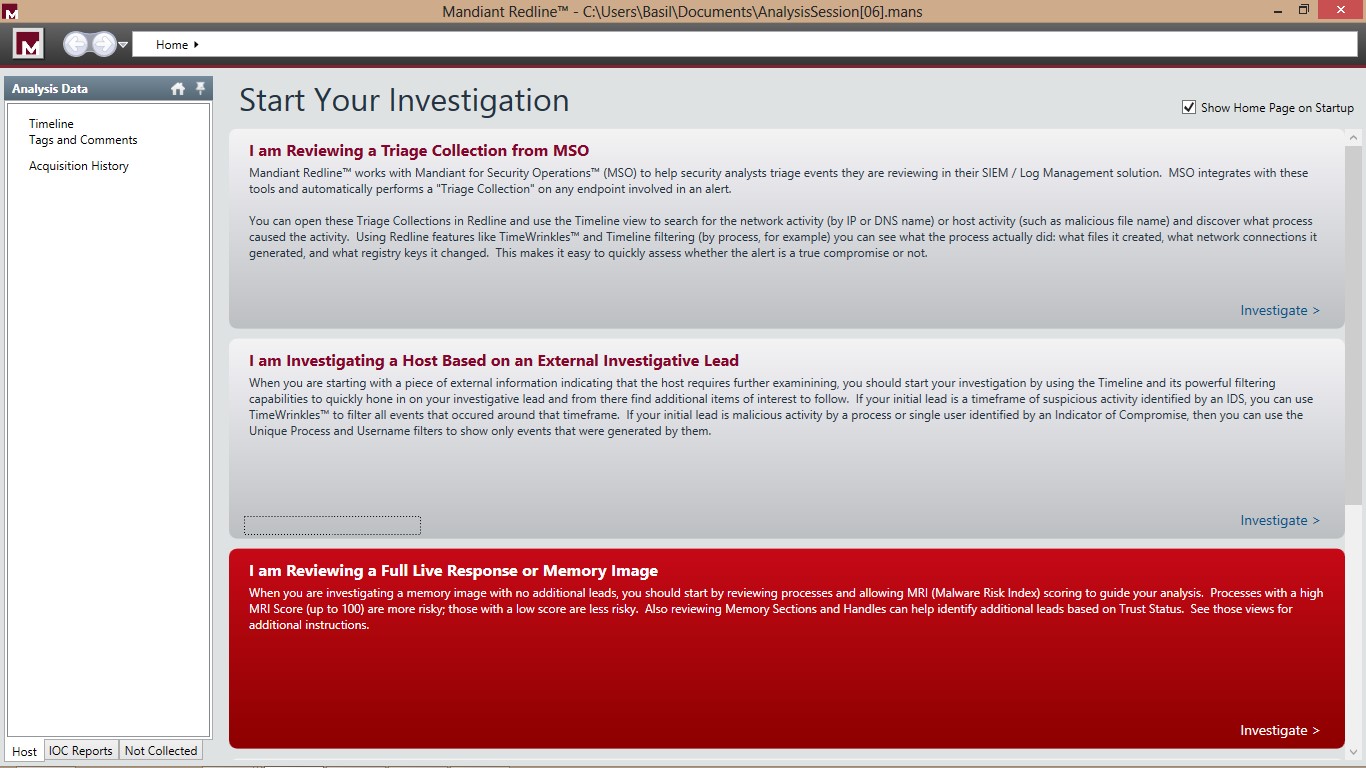
Now our Image is ready for Review:.jpg)
From the left hand side you can choose which type of Data you would like to analysis in this view it’s the “Processes”
Here you can find all the process which was running on the system when the memory image was acquired . It shows the full details about the process such as the Process ID,Path ,Arguemnts ,User name ,SID …etc .
If you would like to view the open ports on the System while the image was acquired , To view ports, click Ports under Processes on the Analysis Data window’s Host tab.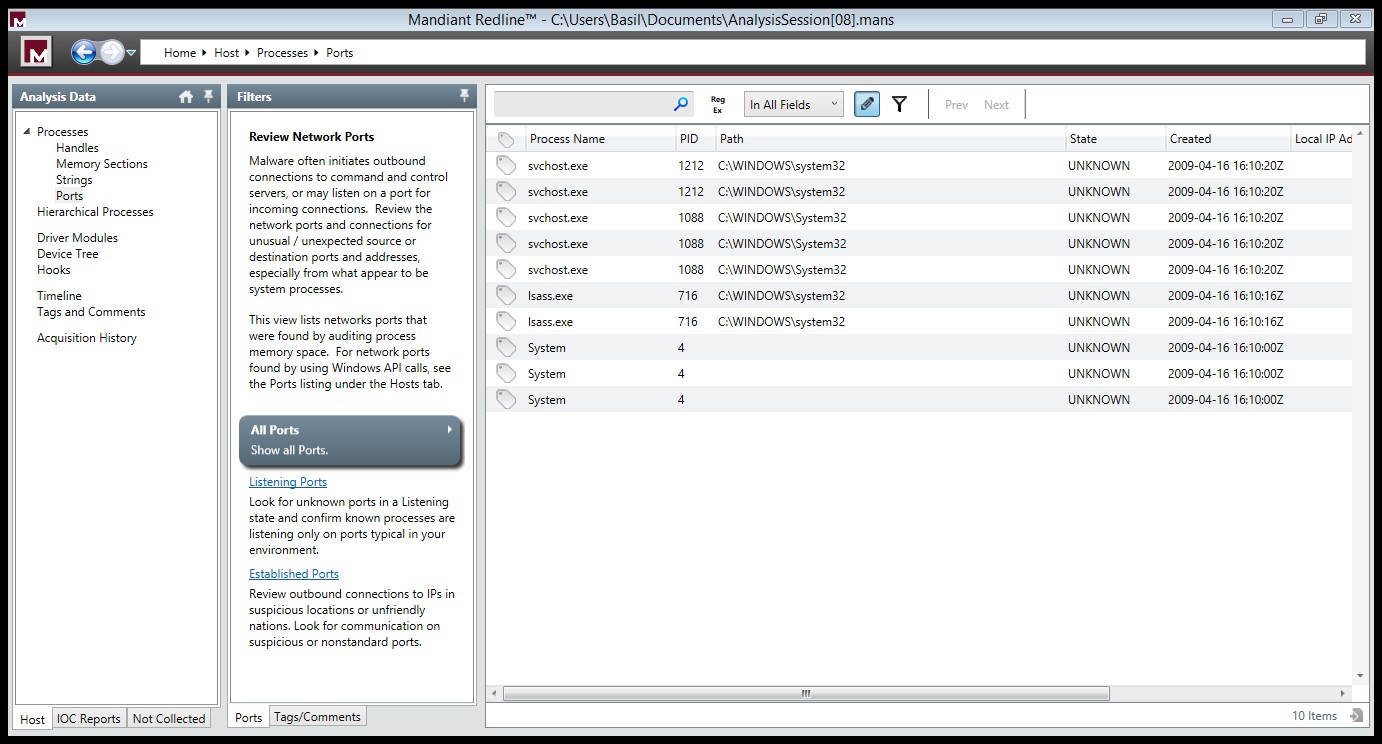


Comments