Integrating Pi-hole Logs in ELK with Logstash
I wanted to parse and ingest my Pi-hole DNS logs for a while now in Elasticsearch to be able to analyze them in various ways. I wrote four separate Grok parser for Logstash to send the logs to a ELK stack. I am now able to view and analyze which domains have been Sinkhole by gravity.list or regex.list (custom wildcard lists) and create the necessary dashboards to report on the DNS traffic. This is an example of the output in Discover. In this example, I have filtered out the dns_type: forwarded.
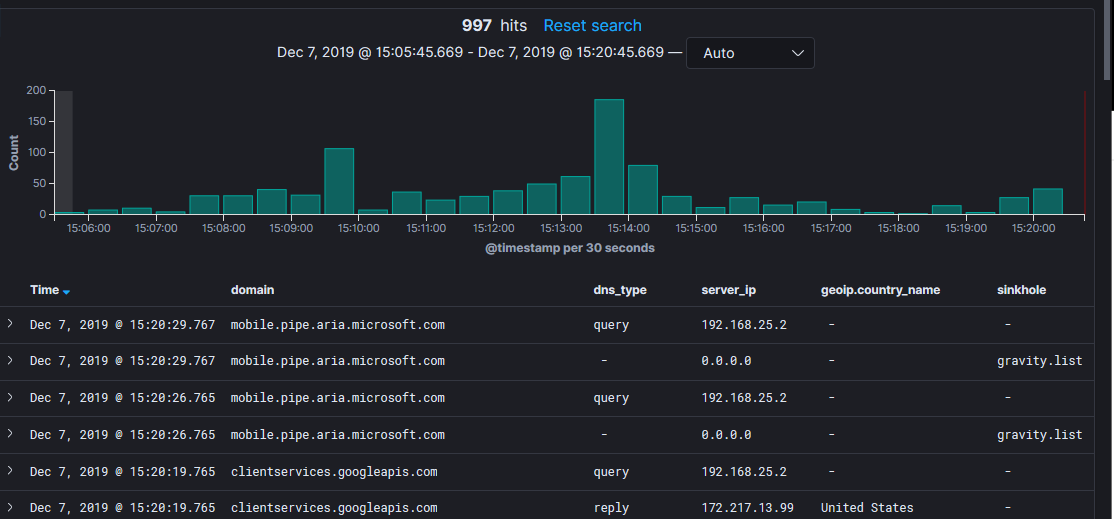
The configuration file can be downloaded here.
[1] https://pi-hole.net/
[2] https://handlers.sans.edu/gbruneau/elk/pihole.conf
[3] https://www.elastic.co/
-----------
Guy Bruneau IPSS Inc.
My Handler Page
Twitter: GuyBruneau
gbruneau at isc dot sans dot edu


Comments
In my case, way back then the documentation for logstash was abysmal so I never did figure out how to teach it to read in MY log data for all of MY hardware and software. (sigh) So one Christmas vacation I wrote a syslog daemon for fun (and to teach myself nodejs) and combining that with elasticsearch and kibana turned out to be better than the commercial log server we had bought. So I deployed it. That turned out to be better than logstash (IMHO) because it also meant I could do some rudimentary log analysis and correlation. For instance, there were patterns of stuff in the email logs that a module in my syslog daemon would watch for that would warn me about possible spear-phish. And it meant I could do things like watch the VPN and windows AD logs to associate IPs with usernames and DHCP logs to associate them with DHCP hostnames, and another module would then add usernames, DHCP hostnames, and geographical info to things like DNS query logs. :-) It was slick.
And using kibana to play "what if" games with the resulting log data yielded some really excellent results. I crafted a ton of different visualizations and dashboards to do make statistical anomalies poke me in the eye (things like systems suddenly hitting the DNS filters hard or a DMZ'd system suddenly hitting the outbound firewall filters hard)
I made a video about it here:
https://www.minds.com/newsfeed/783558588600688656?referrer=linuxgeek
Anyway, yeah, get SOME sort of tool for your log data, log anything and everything, make graphs/visualizations of your log data and go trolling through it looking for "interesting". You'll be surprised at what you find, and better yet you may be surprised at what sort of warnings/alerts you can get with thinking like an attacker and what they'd do if they broke in and what they'd do next, then setup some tripwires -- make sure that kind of activity will get logged and noted and SEEN by someone.
Anonymous
Dec 10th 2019
6 years ago
Anonymous
Dec 11th 2019
6 years ago
Anonymous
Dec 11th 2019
6 years ago
Anonymous
Dec 13th 2019
6 years ago