PCAP Data Analysis with Zeek
Having full packet captures of a device or an entire network can be extremely useful. It is also a lot of data to go through and process manually. Zeek [1] can help to simplify network traffic analysis. It can also help save a lot of storage space. I'll be going through and processing some PCAP data collected from my honeypot. First, we need to install a couple tools to process the PCAP data. I started with a fully updated Ubuntu 22.04.1 LTS desktop [2]. The steps to get our Zeek data from raw PCAPs will be:
- Install pcapfix [3]
- Repair PCAPs with pcapfix
- Install Wireshark [4]
- Merge PCAPs using mergecap [5]
- Install Zeek
- Process merged PCAP with Zeek
PCAP Repair with pcapfix
The PCAPs being collected on my PCAP honeypot are often interrupted due to daily scheduled restarts of the honeypot. These interruptions can cause the PCAPs to have file formatting issues. Common errors may include:
- "The capture file appears to have been cut short in the middle of a packet" (Wireshark)
- "line 1: unrecognized character" (Zeek)
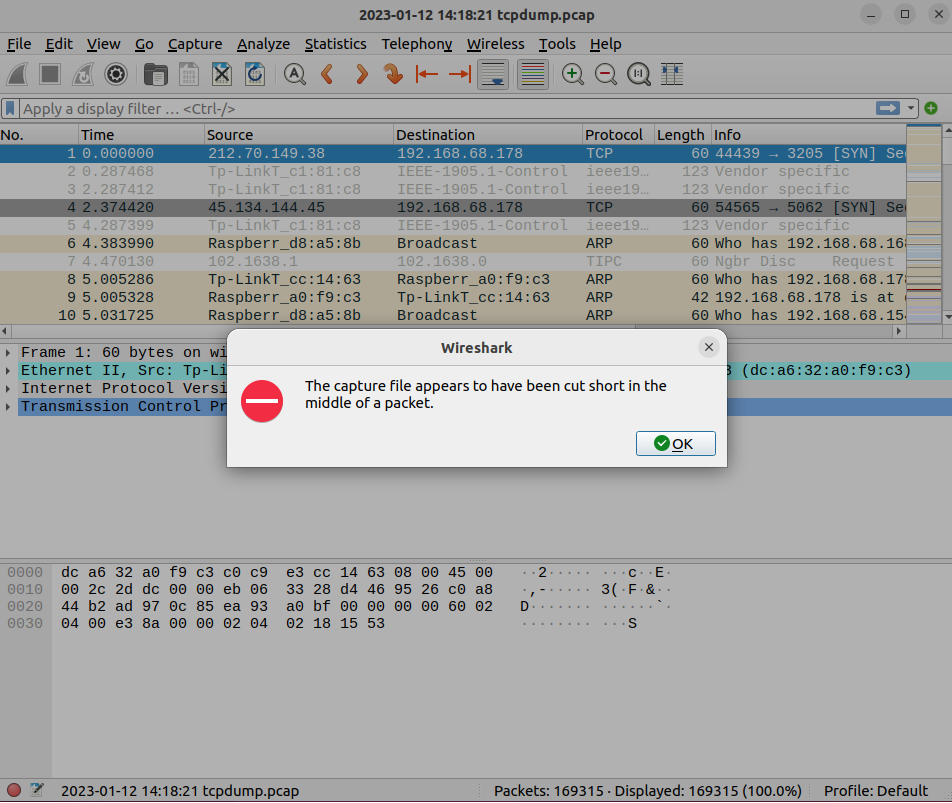
Figure 1: Example Wireshark error with PCAP file that has missing data
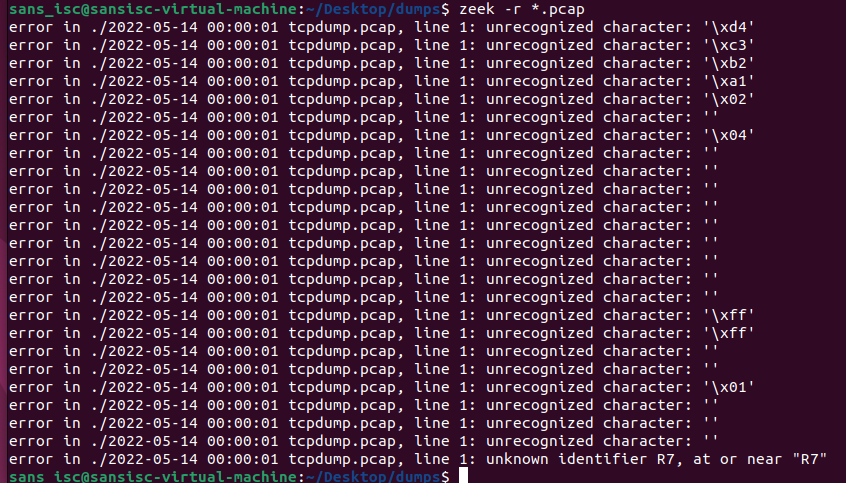
Figure 2: Example Zeek processing error with PCAP file that has missing data
A useful utility to repair PCAP files is pcapfix. First, it needs to be installed.
sudo apt-get install pcapfix
Once installed, it's easy to run the pcapfix utility against all of the PCAP files in the current directory.
find *.pcap -exec pcapfix {} \;
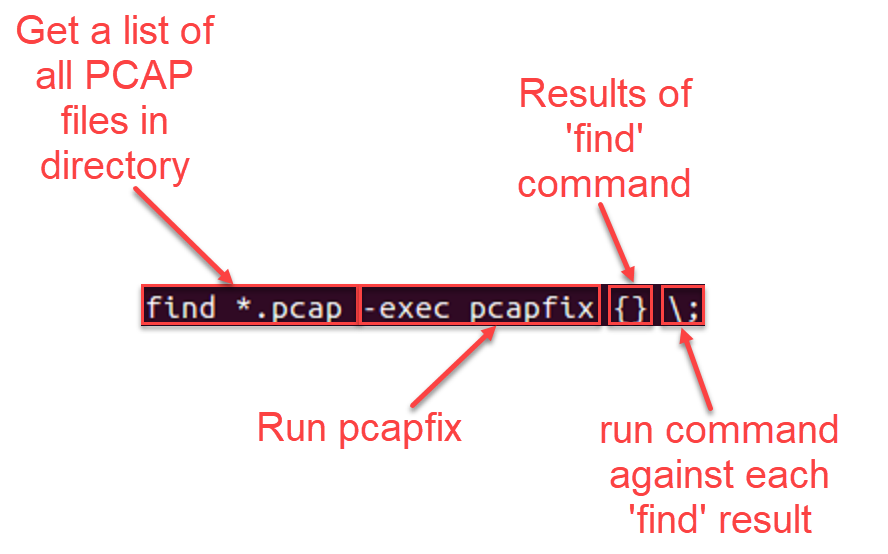
Figure 3: Breakdown of example command to run pcapfix for each PCAP file found in directory
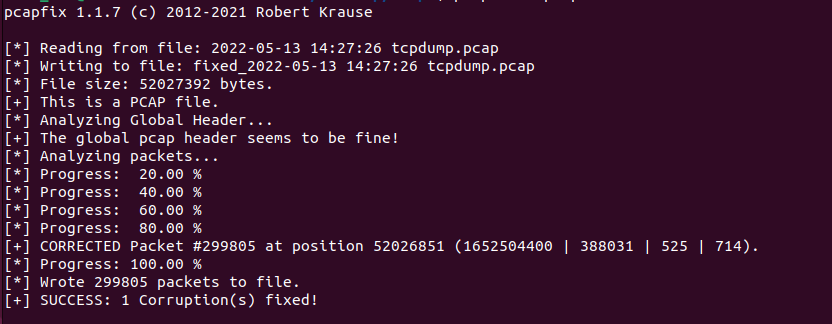
Figure 4: Example pcapfix output
Now that the individual files have been repaired, the can be combined into one file. This also means that the utilities used to combine the PCAP files must also be installed. Since by default, the names of the files created by pcapfix all start with "fixed", it's also a straightforward process.
#Install Wireshark and utilities
sudo apt-get install wireshark-common

#Combine repaired PCAP files into combined_pcap.pcap
mergecap fixed*.pcap -w combined.pcap
Installing Zeek and Processing PCAP
The default installation of Ubuntu for me did not have curl installed. Once installed, the instructions found in the Zeek documentation [6] should work without issue.
#Install curl so repository data can be downloaded
sudo apt-get install curl

#Add repository and install Zeek
echo 'deb http://download.opensuse.org/repositories/security:/zeek/xUbuntu_22.04/ /' \
 | sudo tee /etc/apt/sources.list.d/security:zeek.list

curl -fsSL https://download.opensuse.org/repositories/security:zeek/xUbuntu_22.04/Release.key \
| gpg --dearmor | sudo tee /etc/apt/trusted.gpg.d/security_zeek.gpg > /dev/null

# Install Zeek
sudo apt update
sudo apt install zeek-lts

#Add Zeek install path to $PATH variable
export PATH="/opt/zeek/bin/:$PATH"
Once installed, all that's left is processing the PCAP file.
zeek -r combined.pcap
Before digging into the data itself, let's look at some information about the data collected on the honeypot.
- Days of PCAP data: 270 days
- PCAP file size: 15 GB
- Average daily PCAP size: 55 MB
- Zeek processing time: 57 minutes
- Zeek data file size: 3.4 GB
The space required to store Zeek data is much less than the full PCAP file. If compressed, this would be much more significant. Even when compressed, the data could also still be reviewed with common utilies such as zcat, zeek-cut [7], cut and awk.
Looking at the files we're left with, there's a bit more to unpack.
Figure 5: Files generated from Zeek processing
Reviewing Zeek Data
Zeek will output files specific for each protocol seen in the network traffic [8]. This can make it easier to focus in on one type of traffic. We can also get some easy information from files like the connection log "conn.log". The connection log will show us the connections attempted. The use of the zeek-cut utility will be helpful to limit our data to specific columns within the log file.
If I wanted to see the most common ports coming into the honeypot, assuming the honeypot had the IP of 192.168.68.178, the following command would get us there.
# cat conn.log --> read the connection log file
# zeek-cut id.resp_h id.resp_p --> only show dest host and port columns
# grep 192.168.68.178 --> only show destination host IPs of 192.168.68.178
# awk '{print $2}' --> only print the second column (id.resp_p = destination port)
# sort --> sort the data to prep for counting results
# uniq -c --> count unique ports and display how many times they appear
# sort -rn --> reverse sort the results by how many times items appear
# head -n 10 --> show only first 10 results

cat conn.log | zeek-cut id.resp_h id.resp_p | grep 192.168.68.178 | awk '{print $2}' | sort | uniq -c | sort -rn | head -n 10
The results we get are not surprising, especially looking at the ports the honeypot is usually listening on.
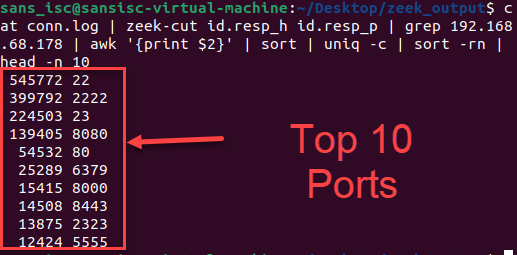
Figure 6: Top 10 ports going to the honeypot IP
The connection logs can help us understand established connections and whether data was exchanged.
# cat conn.log --> output contents of conn.log
# zeek-cut id.resp_h  conn_state --> only show data for the responding host and connection state
# awk '{if($1 == "192.168.68.178") print $2}'  --> print connection state if responding host is honeypot IP
# sort --> sort the data output
# uniq -c --> show unique values and the number of times each value showed up in the data
# sort -n --> sort the data by count

cat conn.log | zeek-cut id.resp_h  conn_state | awk '{if($1 == "192.168.68.178") print $2}' | sort | uniq -c | sort -n
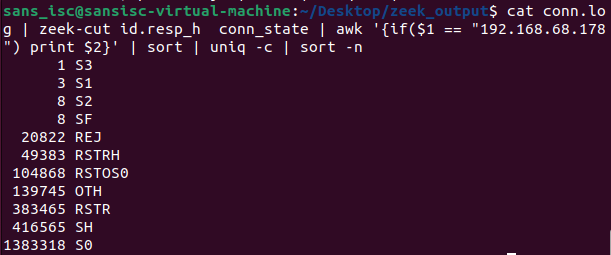
Figure 7: Connection states and number of times they occurred
The results seen in this case were a bit unusual since the honeypot is active interacting with traffic coming in from the internet, including SSH and web traffic. The Zeek documentation [9] can help interpret the results.
- S0: Connection attempt seen, no reply.
- S1: Connection established, not terminated.
- SF: Normal establishment and termination. Note that this is the same symbol as for state S1. You can tell the two apart because for S1 there will not be any byte counts in the summary, while for SF there will be.
- REJ: Connection attempt rejected.
- S2: Connection established and close attempt by originator seen (but no reply from responder).
- S3: Connection established and close attempt by responder seen (but no reply from originator).
- RSTO: Connection established, originator aborted (sent a RST).
- RSTR: Responder sent a RST.
- RSTOS0: Originator sent a SYN followed by a RST, we never saw a SYN-ACK from the responder.
- RSTRH: Responder sent a SYN ACK followed by a RST, we never saw a SYN from the (purported) originator.
- SH: Originator sent a SYN followed by a FIN, we never saw a SYN ACK from the responder (hence the connection was “half” open).
- SHR: Responder sent a SYN ACK followed by a FIN, we never saw a SYN from the originator.
- OTH: No SYN seen, just midstream traffic (one example of this is a “partial connection” that was not later closed).
One of my other network capture sources on the network shows SF as the second most common connection state. This is what I would anticipate knowing the interactions happening between the internet and the honeypot. A future project will be comparing these different capture sources and outlining the variations. Some possibilities for the differences could be:
- Different perspectives of capture (network span port versus host capture)
- tcpdump capture command differences
- Network architecture complications (two firewalls exist between my span port captures - host-based on the honeypot and a hardware firewall)
- Resource issues on equipment causing packet capture loss
- PCAP file inconsistencies on honeypot
While this will be an excellent project in the future, let's take a look at some other summary information from one of the other protocol files. Since one of the features of the DShield honeypot [10] is a web server, let's take a look at web traffic in the http.log file.
# cat http.log --> output http.log file
# zeek-cut method  --> extract HTTP method column
# sort --> sort results by name
# uniq -c --> list unique entries and how many times they occurred
# sort -rn --> reverse sort the list by count (descending order)
# head -n 10 --> show the first 10 results

cat http.log | zeek-cut method | sort | uniq -c | sort -rn | head -n 10;
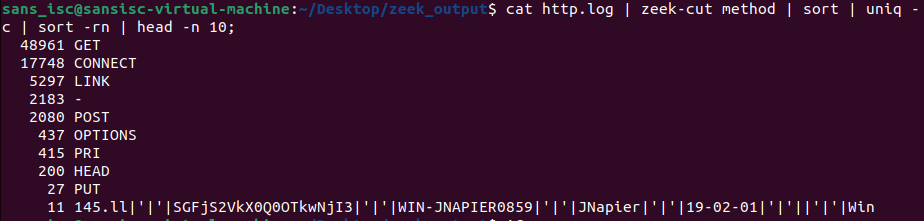
Figure 8: Output of unique HTTP method occurences
Already we get an interesting outlier in the list that looks unusual. We can dig a bit more into this result by searching for the unusual HTTP method data.
# cat http.log --> output http.log file
# zeek-cut uid method --> extract uid and method columns from data
# awk '{if($2 ~ "WIN-JNAPIER0859") print $1 "\t" $2} --> if method contains WIN-JNAPIER0859, print the columns separated by tabs

cat http.log | zeek-cut uid method | awk '{if($2 ~ "WIN-JNAPIER0859") print $1 "\t" $2}'
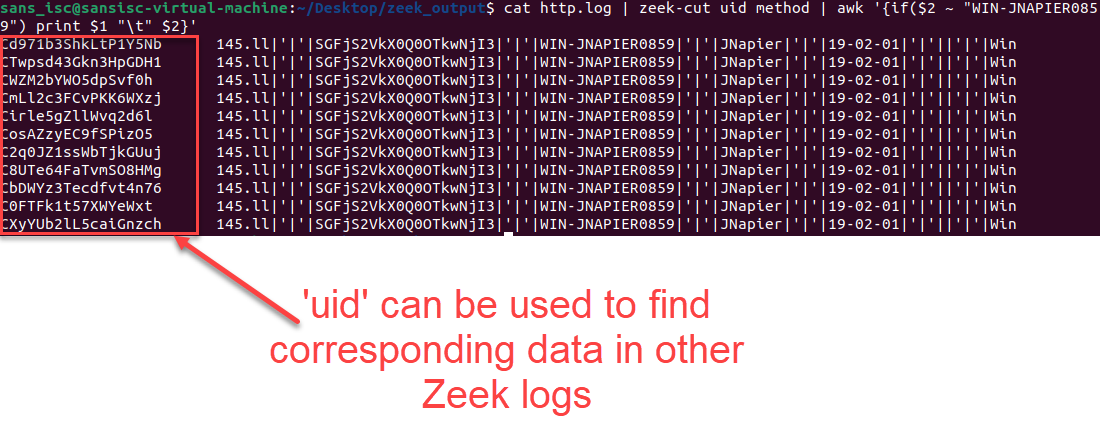
Figure 9: Results of UID and method searching for matching method text
One of the nice things about Zeek is that it also generates a 'uid' that can be used to correlate different data in the various log files. Using this 'uid', we can see if there are any other references to this network traffic.
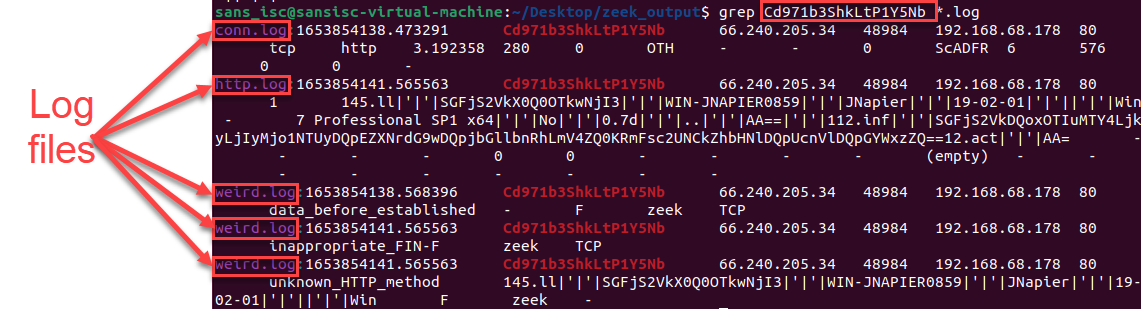 Figure 10: Results from searching for specific uid within all Zeek log files
From the results we see the different log files the specific uid was seen in. This also highlights that the 'weird.log' file can be a good place to go to look for activity if interest. Some of these strings also appear base64 encoded and Cyberchef [11] help us decode it.
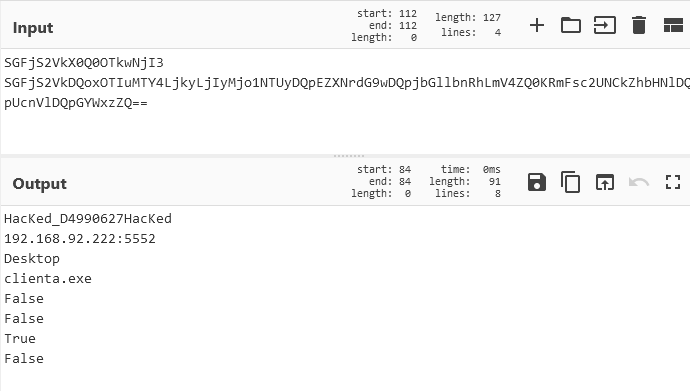
Figure 11: Base64 decoded data from HTTP method
Zeek can help save to save on storage space and enable us to search for data quickly using basic text tools. I'll compare some of the different network data I have for my honeypot in the future to investigate the diviations noted.
[1] https://github.com/zeek/zeek
[2] https://ubuntu.com/download/desktop
[3] https://github.com/Rup0rt/pcapfix
[4] https://www.wireshark.org/
[5] https://www.wireshark.org/docs/man-pages/mergecap.html
[6] https://docs.zeek.org/en/master/install.html
[7] https://docs.zeek.org/en/master/log-formats.html
[8] https://docs.zeek.org/en/master/logs/index.html
[9] https://docs.zeek.org/en/master/scripts/base/protocols/conn/main.zeek.html
[10] https://isc.sans.edu/honeypot.html
[11] https://gchq.github.io/CyberChef/
--
Jesse La Grew
Handler


Comments