Anti-Debugging Technique based on Memory Protection
Many modern malware samples implement defensive techniques. First of all, we have to distinguish sandbox-evasion and anti-debugging techniques. Today, sandboxes are an easy and quick way to categorize samples based on their behavior. Malware developers have plenty of tests to perform to detect the environment running their code. There are plenty of them, some examples: testing the disk size, the desktop icons, the uptime, processes, network interfaces MAC addresses, hostnames, etc.
On the opposite, anti-debugging techniques are implemented to make the life of malware analysts more difficult. That's the next step in the "malware analysis pyramid", executing the malicious code into a debugger. Here again, they are many techniques available from very easy ones provided by the Microsoft API like isDebuggerPresent()[1] which returns 1 or 0 depending on the process being attached to a debugger. Note that this API call just checks the flag 'isDebugged" located in the second byte of the PEB[2] or "Process Environment Block".
Another technique is to search for interesting programs via their window title and the API call FindWindow()[3]. Easy to spot a running "x32dbg". Usually, when a program is being debugged, its execution is very slow. Thanks to GetTickCount()[4], it is possible to detect a long time between two system calls.
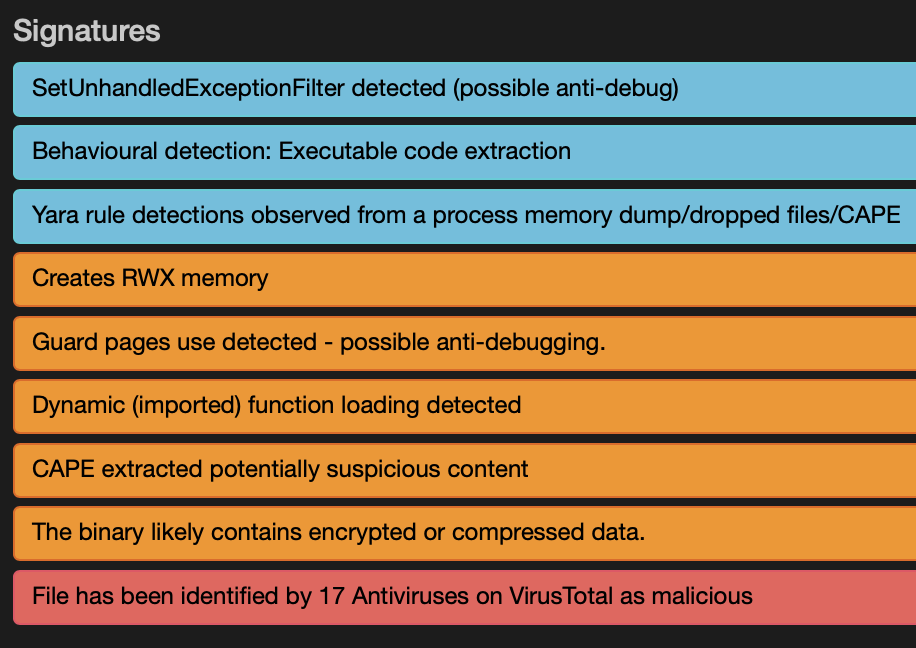
Some techniques are less usual but used from time to time. I found one yesterday via my sandbox:

The Windows kernel allows allocating memory in different ways depending on the future usage. When the malware will perform process injection, the memory must be allocated with the flag PAGE_EXECUTE_READWRITE (0x40). It's the case in the sample (see above).
There exist many flags for memory allocation[5], one that is interesting is PAGE_GUARD (0x100). Here is the description from the Microsoft documentation:
"Pages in the region become guard pages. Any attempt to access a guard page causes the system to raise a STATUS_GUARD_PAGE_VIOLATION exception and turn off the guard page status. Guard pages thus act as a one-time access alarm."
From a malware perspective, this is very interesting! Guard pages can be used by packers to unpack memory pages "on-demand": they are allocated and protected by PAGE_GUARD then accessed. The generated exception is intercepted and, if it matches the memory page, the content is processed. But, more interesting, the technique of guard pages detection can help to detect the presence of a debugger with the creation of PAGE_GUARD memory page and accessing it. If the exception STATUS_GUARD_PAGE_VIOLATION occurs, it’s assumed no debugging is in place.
Here is an example of protected memory allocation from the sample:

If you are interested in this sample, its SHA256 is 4251133ebe04bf0de34a7a1972342c77442942a4c2417f28c56145b2ee9ad451[6]. It has a VT score of 17/73.
[1] https://docs.microsoft.com/en-us/windows/win32/api/debugapi/nf-debugapi-isdebuggerpresent
[2] https://docs.microsoft.com/en-us/windows/win32/api/winternl/ns-winternl-peb
[3] https://docs.microsoft.com/en-us/windows/win32/api/winuser/nf-winuser-findwindowa
[4] https://docs.microsoft.com/en-us/windows/win32/api/sysinfoapi/nf-sysinfoapi-gettickcount
[5] https://docs.microsoft.com/en-us/windows/win32/memory/memory-protection-constants
[6] https://www.virustotal.com/gui/file/4251133ebe04bf0de34a7a1972342c77442942a4c2417f28c56145b2ee9ad451/behavior/Dr.Web%20vxCube
Xavier Mertens (@xme)
Senior ISC Handler - Freelance Cyber Security Consultant
PGP Key


Comments