macOS: Who?s Behind This Network Connection?
When you must investigate suspicious behavior or work on an actual incident, you could be asked to determine who’s behind a network connection. From a pure network point of view, your firewall or any network security control device/app will tell you that the source is the connection is host « A », « B » or « C ». But investigating further how to discover who or which process is the source of the connection (now, at the operating system level).
I faced this situation recently when a customer asked me for help to link a process to a suspicious TCP connection performed regularly by a Macbook. How to achieve this?
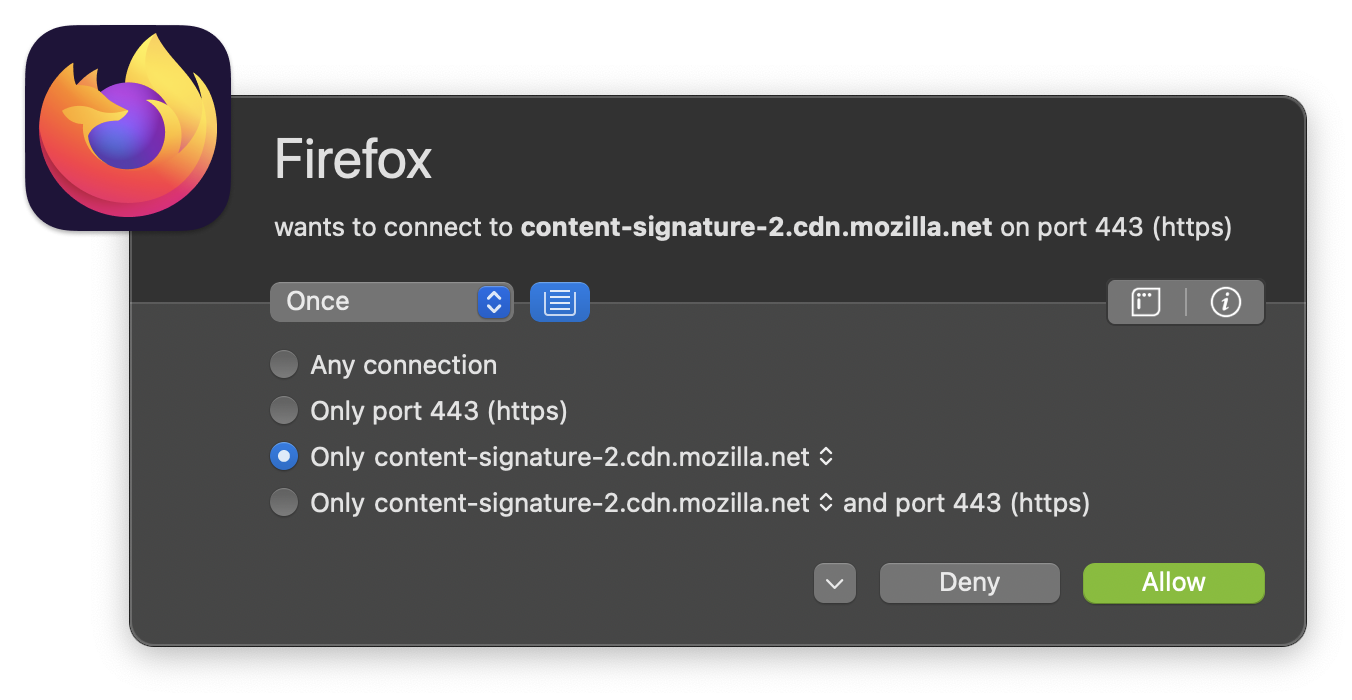
My first reflex was to mention LittleSnitch (I’m a big fan of it and have used it for years). This egress firewall will notify you when a process attempts to connect to a network service (and you can approve/deny the request).

A really fantastic tool to see in a friendly GUI what’s happening. But LittleSnitch wasn’t installed. You need to install a demo license, which is not convenient in this case.
If MacOS is a graphical OS, it comes with plenty of « UNIX » tools that might be helpful. You can use « lsof » to gather a list of network flows and their associated PIDs. The problem here is root access is required or sudo access. In my case, the end-user had no admin rights on the Macbook.
xavier : ~ $ sudo lsof -i|grep -i firefox
firefox    5356          xavier   94u  IPv4 0x505ae1c0f002003      0t0    TCP 192.168.254.212:52429->55.65.117.34.bc.googleusercontent.com:https (ESTABLISHED)
Finally, MacOS comes with a lot of « Apple » tools. One of them is nettop. A command, available for years that displays the network flows in real-time and… the applications! The cool stuff is that no root nor sudo access is required to run it. If you can use nettop in interactive mode (like the well-known top tool) and sort flows in many ways, there is a more automated way to use it and log useful information for some time:
xavier : ~ $ nettop -L 0
This command will dump all connections and their associated process at regular intervals (and for an unlimited amount of time with the value "0"). The output format will be CSV. If we search for Firefox, we will see this:
12:49:53.399032,firefox.5356,,,5427,1386,0,0,0,,,,,,,,,,,,
12:49:53.392327,tcp4 192.168.254.212:52429<->55.65.117.34.bc.googleusercontent.com:443,en7,Established,5427,1386,0,0,0,39.81 ms,131072,69376,BE,-,cubic,-,-,-,-,so,
(Be careful; the process name is not present on all lines! Connections are grouped under the line describing the process)
This tool has many features not covered here, have a look at the manpage. You can leave this command running and analyze the logs later!
Xavier Mertens (@xme)
Xameco
Senior ISC Handler - Freelance Cyber Security Consultant
PGP Key


Comments
I haven't tried it, but it is an Open Source outbound firewall for MACs, that appears to do logging.
Nick
Aug 28th 2023
2 years ago
-k Control the display of packet metadata via an optional metadata_arg argument. This is useful when displaying packet saved
in the pcap-ng file format or with interfaces that support the PKTAP data link type.
By default, when the metadata_arg optional argument is not specified, any available packet metadata information is
printed out.
The metadata_arg argument controls the display of specific packet metadata information using a flag word, where each
character corresponds to a type of packet metadata as follows:
I interface name (or interface ID)
N process name
P process ID
S service class
D direction
C comment
This is an Apple modification.
JonasL
Aug 29th 2023
2 years ago