Docker Containers Logging
In a previous diary, Jim talked about forensic operations against Docker containers. To be able to perform investigations after an incident, we must have some "fresh meat” to search for artefacts. As Jim explained, memory is always a nice place to search (volatility is your best friend) but memory is... volatile! Docker is also very volatile by design. You don't know exactly where the containers are deployed and a system access to collect a memory image is not always easy. To increase our chances to find artefacts, it’s always better to collect data before the incident occurs and there is no magic: logs remain the best way to collect data.
Docker comes with multiple ways to logs containers’ events. More and more focus has been put on logging and today, many ways are available:
- JSON-file (JSON messages written to a flat file)
- Syslog
- Journald
- GELF (Graylog Extended Log Format - used with Logstash)
- Fluent
- AWSlog (Amazon Web Services)
- Splunk
- ETWlogs (on Windows)
- GCPlogs (Google Cloud Logging)
The default driver is ‘json-file’. Files are written on the Docker host (where the daemon is running) and are located in the following directory:
/var/lib/docker/containers/(CONTAINER_ID)/(CONTAINER_ID) -json.log
To review the logs, the command “docker logs ” can be used:
# docker logs dshield
Validating provided credentials...
API key verification succeeded!
Starting cowrie...
Removing stale pidfile /srv/cowrie/cowrie.pid
Easy but not very convenient and data remains stored on the box. By design, some containers may have a very limited lifetime and once deleted, logs are gone too. It’s easy to replace the default driver with your preferred one. At daemon level, specify the driver to use and its options.
# docker daemon --log-driver=--log-opt
Each driver comes with its own set of options that can be fine-tuned with '--log-opt =’. Example for the Syslog driver, we can configure the remote Syslog server and facility. More information about the different ways to configure logging is available on the Docker website. On Ubuntu, the best way to change the default configuration is to change the 'DOCKER_OPTS' environment variable in /etc/default/docker/. Here is mine:
DOCKER_OPTS='--log-driver=splunk \
--log-opt splunk-token=xxxxxxxx-xxxx-xxxx-xxxx-xxxxxxxxxxx \
--log-opt splunk-url=https://splunk.fqdn.tld:8088 \
--log-opt splunk-insecureskipverify=true \
--log-opt tag="{{.ImageName}}/{{.Name}}/{{.ID}}" \
--log-opt labels=type,location'
Personally, I like the Splunk HTTP Event Collector. It is based on the web protocol and easy to deploy. Once you configured your Splunk instance to receive events from Docker, you will have a full visibility. Notice that you can use another driver for a specific container (ex: if you run a container for a customer or partner who want to use a Syslog destination).
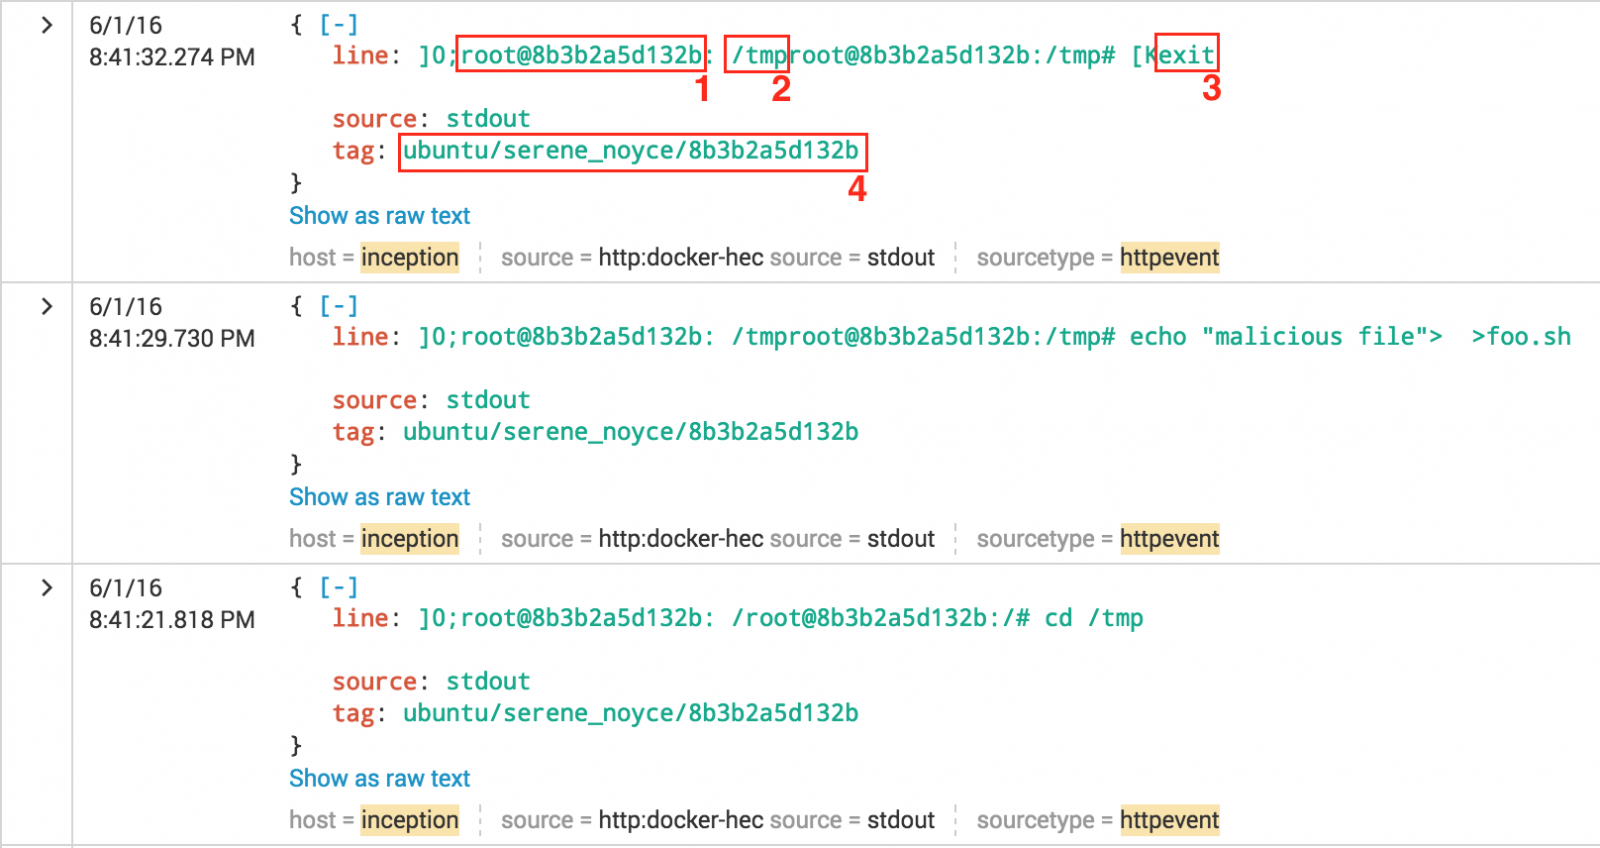
Here is an example of a simple bash output in a Ubuntu container:

We find many interesting information:
(1) the user on the container ID
(2) the working directory
(3) the typed command in bash
(4) the image, container name and ID
Two important notes about containers logging: The first one is about timestamps: By default a container is started with a clock set to UTC. Keep this in mind while performing investigations. To fix the correct time zone, add the following lines in your Dockerfile:
# Set the timezone
RUN echo "Europe/Brussels" > /etc/timezone
RUN dpkg-reconfigure -f noninteractive tzdata
The second point is about logging network traffic. When the Docker daemon is started, a network dedicated to containers is deployed. An extra interface 'docker0' is created and a subnet is dedicated to containers. An IP address is dynamically assigned to the container when launched. From a forensic perspective, it is very interesting to log the egress traffic. To have a better visibility about the traffic from/to container, enable extra logging via the following command:
# iptables -L FORWARD 1 -j LOG
This will generate extra Syslog events (can be a huge amount!). The first one is an ongoing connection from a container, the second is an incoming connection:
Jun 1 20:15:36 inception kernel: [8415191.429757] IN=docker0 OUT=eth0 PHYSIN=veth2ad35f6 \ MAC=02:42:c6:a7:b3:f2:02:42:ac:11:00:04:08:00 SRC=172.17.0.4 DST=172.16.0.10 LEN=52 TOS=0x00 \ PREC=0x00 TTL=63 ID=15759 DF PROTO=TCP SPT=41017 DPT=25 WINDOW=229 RES=0x00 ACK URGP=0 Jun 1 20:59:10 inception kernel: [8417805.742798] IN=eth0 OUT=docker0 \ MAC=c2:41:32:db:26:fc:00:00:24:d0:69:51:08:00 SRC=5.45.72.51 DST=172.17.0.6 LEN=140 TOS=0x18 \ PREC=0x20 TTL=117 ID=7085 DF PROTO=TCP SPT=50424 DPT=2222 WINDOW=512 RES=0x00 ACK PSH URGP=0
In many applications and products, the default settings lack of proper logging. Be sure sure to review the settings to generate enough events to investigate later! Happy hunting...
Xavier Mertens
ISC Handler - Freelance Security Consultant
PGP Key
My next class:
| Reverse-Engineering Malware: Advanced Code Analysis | Online | US Eastern | Mar 29th - Apr 2nd 2026 |
×
![modal content]()
Diary Archives


Comments