Software Crashes: A New Year's Resolution
Recently, I experienced a couple of stop errors (also known as Blue Screen of Death) on a Windows machine, that I was able to fix with the help of NirSoft's BlueScreenView utility. With this utility, I immediately pinpointed the cause of the crashes to a driver that I was able to update.
And that reminded me of another NirSoft tool: AppCrashView.
Like BlueScreenView, AppCrashView is a convenient GUI programs that presents application crash reports found in the WER folder in a table:
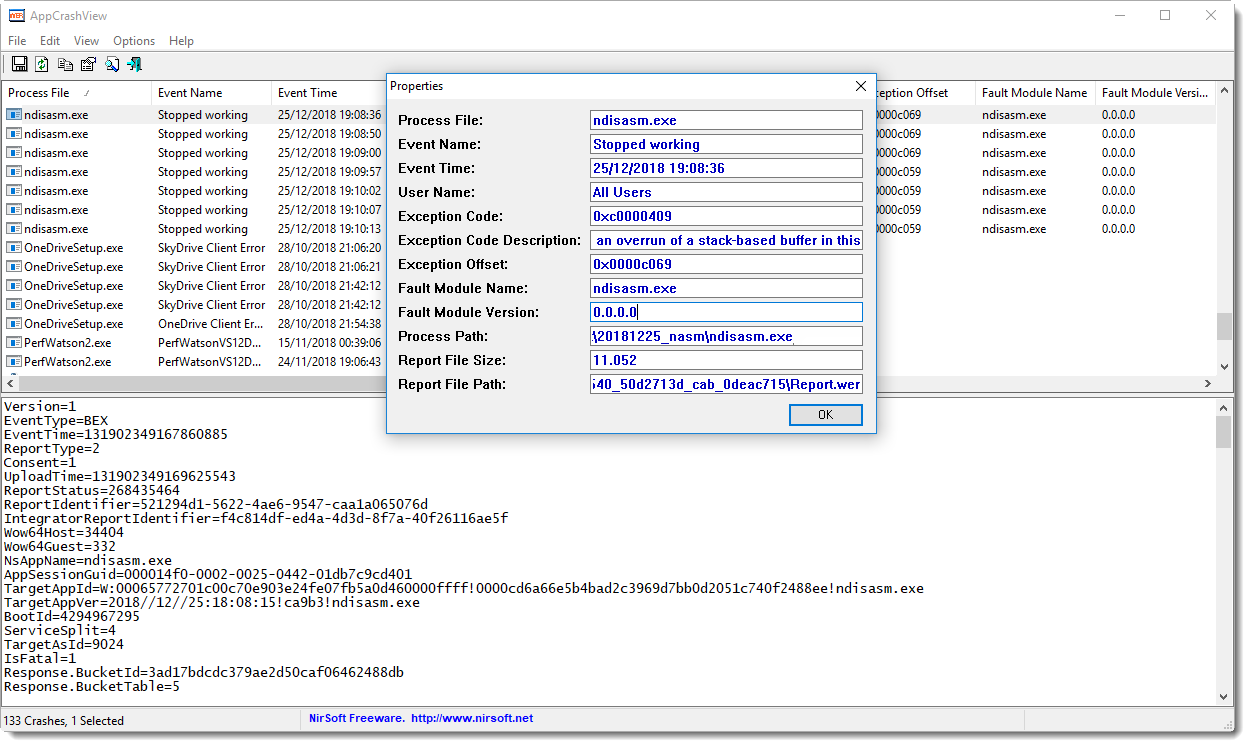
I used to take a regular look at the application crashes on my machine, to identify applications who could have security problems, like buffer overflows. Depending on the results and frequency of crashes, I would update or replace the application.
And sometimes, it was the starting point of vulnerability research.
I will make this a habit again, and you could too, as AppCrashView is a simple, convenient program that gives an tabular overview of application crashes, without requiring a debugger.
If you want to do this in a more organized and scalable way, know that application crashes are also recorded in the Windows Application Event log.
Please post a comment if you have tips or suggestions to monitor application crashes.
Didier Stevens
Senior handler
Microsoft MVP
blog.DidierStevens.com DidierStevensLabs.com


Comments
Anonymous
Dec 31st 2018
7 years ago