Passive Scanning Two Ways - How-Tos for the Holidays
Last week, we discussed why you'd want to do passive vulnerability scanning at strategic points in your network https://isc.sans.edu/diary/Scanning+without+Scanning/17189, and which tools you might commonly do that with. After some reader feedback, I thought we'd discuss just exactly how to do this with both p0f and PVS. Both packages we're discussing have a gotcha or two, so it's worth a "how-to" from start to finish.
And, to paraphrase the Dos Equis guy: "I don't often install an OS on bare metal, but when I do, it's usually a hypervisor". So today's discussion will cover off two methods to do passive scanning of a network segment's traffic inside of a VM.
Passive Scanning for Free - p0f
In this section we'll cover off installing and running p0f, a free passive "fingerprinting" scanner.
First of all, both Security Onion and Kali both come with an older (v2.08) version of p0f. I chose to install the newer version, 3.06b, downloaded from http://lcamtuf.coredump.cx/p0f3/
The first thing that you'll notice is that the install is a bit strange - it's got a bundled "build.sh" installer which checks dependancies then installs. The kicker is that no matter what, it tells you that libpcap isn't installed - even though you KNOW it's there! After finally breaking down and running "vi README" and still getting nowhere, I realized that if I had read the actual messages from build.sh, I would know that it needs the development libraries from libpcap.
To get these (in ubuntu), run "sudo apt-get install libpcap-dev". NOW you can likely run build.sh successfully!
Next, on to running the app. p0f runs by sniffing the network and then reporting on what it sees, so you need to give it something to see. The easy way to do this is to set up a SPAN port on your switch so that traffic from elsewhere is "mirrored" to the p0f port. In this setup, I'm monitoring all traffic on the "family" segment (vlan 1) of my home network. On a cisco switch, this will look similar to:
monitor session 1 source vlan 1
monitor session 1 destination interface g0/2
If you put p0f into a virtual machine, be sure that you either:
a/ dedicate an ethernet to it using vt-d (called DirectPath I/O in ESXi)
or
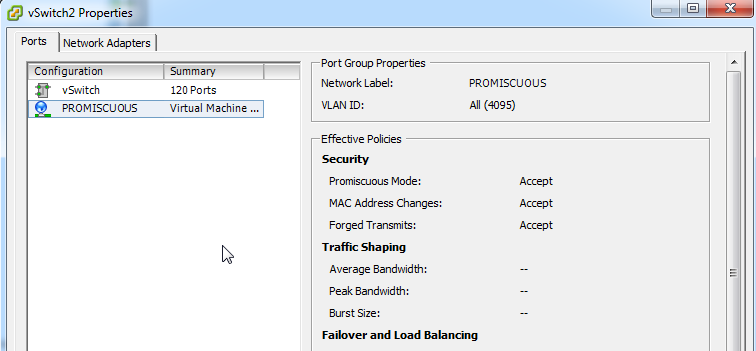
b/ enable promiscuous mode in the virtual switch or port group. Since I've got multiple sniffers on my ESXi host, I chose this second option. I created a dedicated "PROMISCUOUS" vSwitch for this purpose, and attached it to the vNIC attached to the physical switch port g0/2, then set the port group to allow Promiscuous mode. If you are monitoring several VLANS, be sure to put the port group into VLAN 4095 (which tells VMware that the VM will correctly handle tagged frames for multiple VLANs). When done, the vSwitch config looks like:
NOW you're ready to run the app. There are a few different modes to run in.
The basic text output from "sudo p0f -i eth0" will look like:
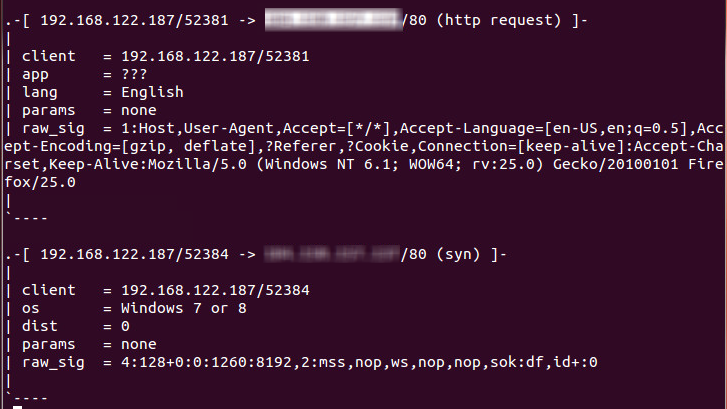
This basic "dump to the screen" mode gives you nicely formatted text, but after a few minutes of watching it whiz by you'll realize that this will be impossible to parse into a spreadsheet or database or really do much useful with. You probably want to output to a file, which will create a CSV file that you can parse into a spreadsheet or database table, using "pvs -i eth0 -o pvsout.txt". Finally, you can also run p0f against an existing saved PCAP file:
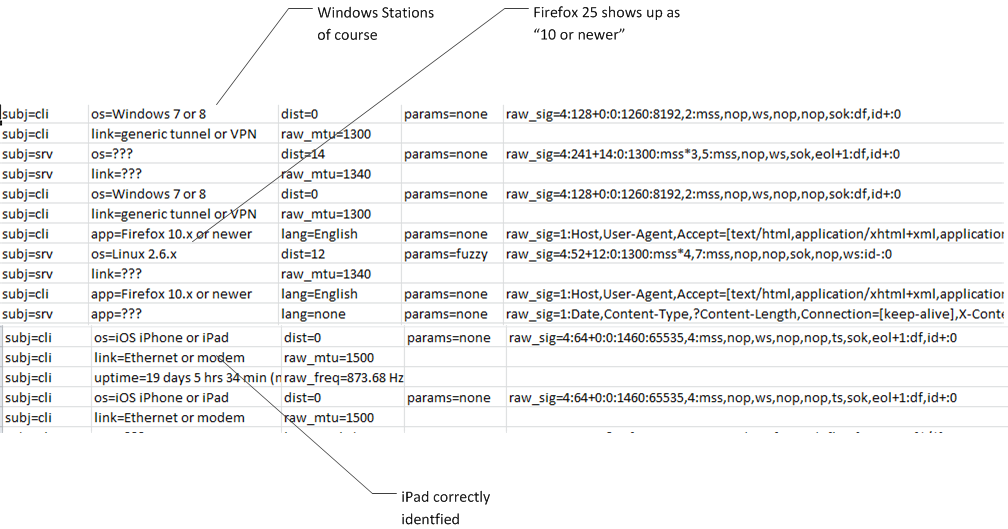
So, what did I find? After importing into excel and playing with the data:
- My windows 7 machine running firefox 25 showed up more than a few times. While the Firefox user agent string correctly identified the browser, p0f ignores that and identifies the browser by other indicators, which is likely a wise choice given how easy it is to lie with your user agent string.
- My kid playing minecraft on his win7 machine
- Various iPhones, iPads and iPods - they all show up as "IOS"
Passive Scanning with a real budget - PVS
Because we used VMware's promiscuous mode support for p0f, I chose to dedicate a NIC using VT-d (DirectPath I/0 in ESXi speak) for PVS. After cabling the NIC (and before I forget), set up the second monitor session on your switch to allow vlan-wide packet sniffing - so, on the switch:
monitor session 1 source vlan 1
monitor session 1 destination interface g0/3
(again, it's in cisco-speak, but everyone's switch monitor syntax is fairly similar)
Back over the VMware, we need to determine which NIC we can use to dedicate to the VM. In our case, it's vmnic3. We'll then use the vCLI to determine which PCI device number is associated with that NIC (we'll need this number in the next step). You can install vCLI on your laptop (the preferred method by far), or run these commands within the hypervisor's CLI if you have that enabled.
esxcfg-nics -l
Name PCI Driver Link Speed Duplex MAC Address MTU Description
vmnic1 0000:04:00.00 e1000e Up 1000Mbps Full 00:e0:81:ce:98:be 1500 Intel Corporation 82574L Gigabit Network Connection
vmnic2 0000:05:00.00 e1000e Up 100Mbps Full 00:e0:81:ce:98:bf 1500 Intel Corporation 82574L Gigabit Network Connection
vmnic3 0000:06:00.00 e1000e Down 0Mbps Half 00:e0:81:ce:98:c0 1500 Intel Corporation 82574L Gigabit Network Connection
Now, over to the vSphere client. We'll edit the VM / Configuration / Advanced Settings, and we'll edit DirectPath I/O. Choose "edit", and enable device 06:00:00 as enabled for passthrough.
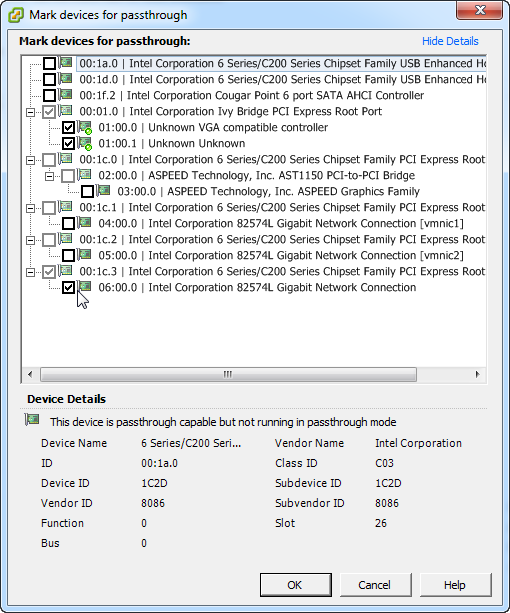
Note that you'll likely see a little red "reboot" icon over the device after it's set up - this indicates that the ESXi host needs a reboot to finish the process. It's so rare that we need to reboot these that it caught me by surprise - good thing it's in my home lab, all I need to book around is my wife using the DLNA server and my kid using the minecraft server.
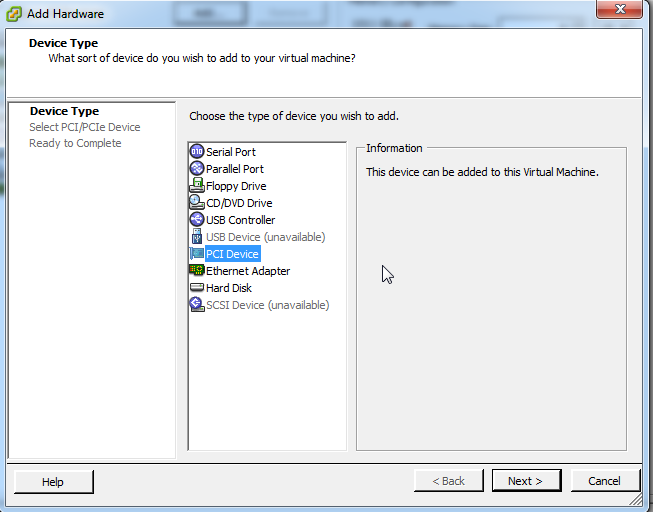
Finally, over to the VM. Add a device, and instead of an Ethernet adapter, we'll select "PCI Device", and choose the ethernet NIC we just reserved.
.png)
Before you start the install of PVS, be sure that you have MS Visual C++ installed (any version, i used the redistributable 2010). If this is a new VM, C++ likely won't be installed and the PVS install will complete with no errors, but it won't work - the PVS install does not check dependancies for you.
Once the install is done, fire up your services list and start "Tenable PVS Proxy" service. The install app won't start this for you.
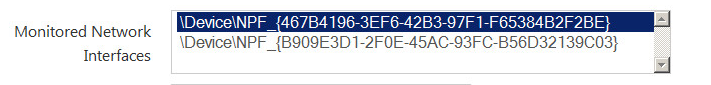
THe final configuration steps are in your browser - browse to https://localhost:8835 - you'll need to identify the network list to be monitored (192.168.122.0/24 in my case), change the default admin/admin credentials, and also identify which interface is "sniffing". Since they represent this in the NPF notation, I cheated and used Wireshark to figure out which interface was which.
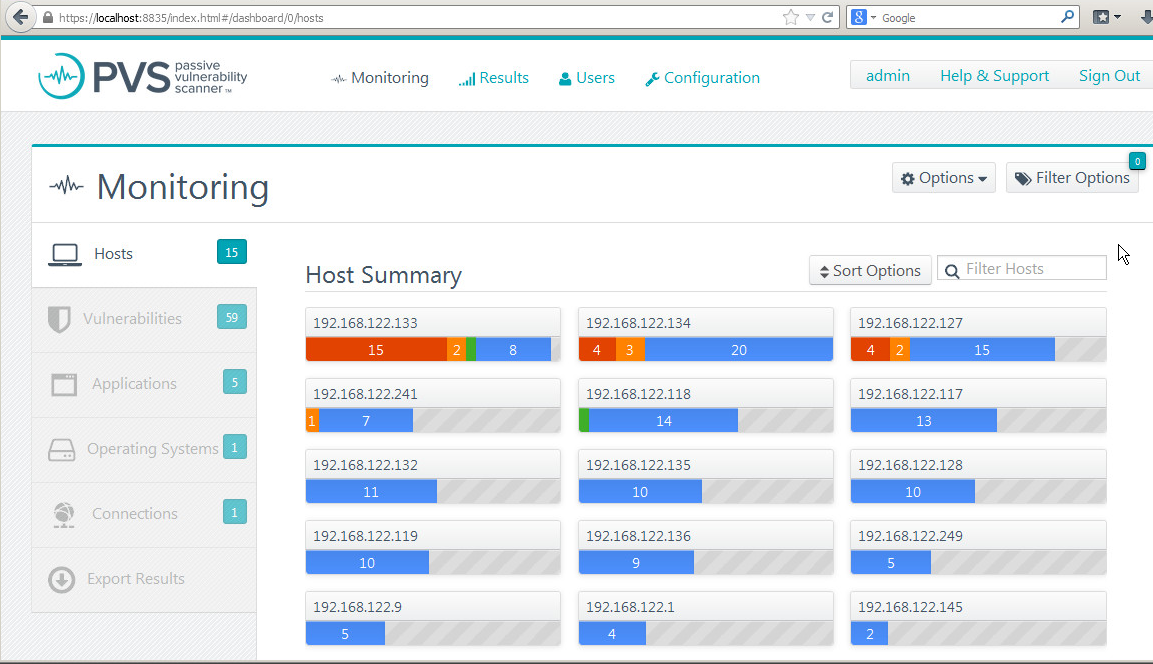
Once installed, the PVS output was pretty much what I expected. I fired up a few ssh and browser sessions on my laptop, hosts and clients where properly identified, the only risk that showed up was my DLNA server was running UPNP - which i need to chase down, I'm not sure it's needed or not. The basic monitor screen shows a colour-coded screen by host:
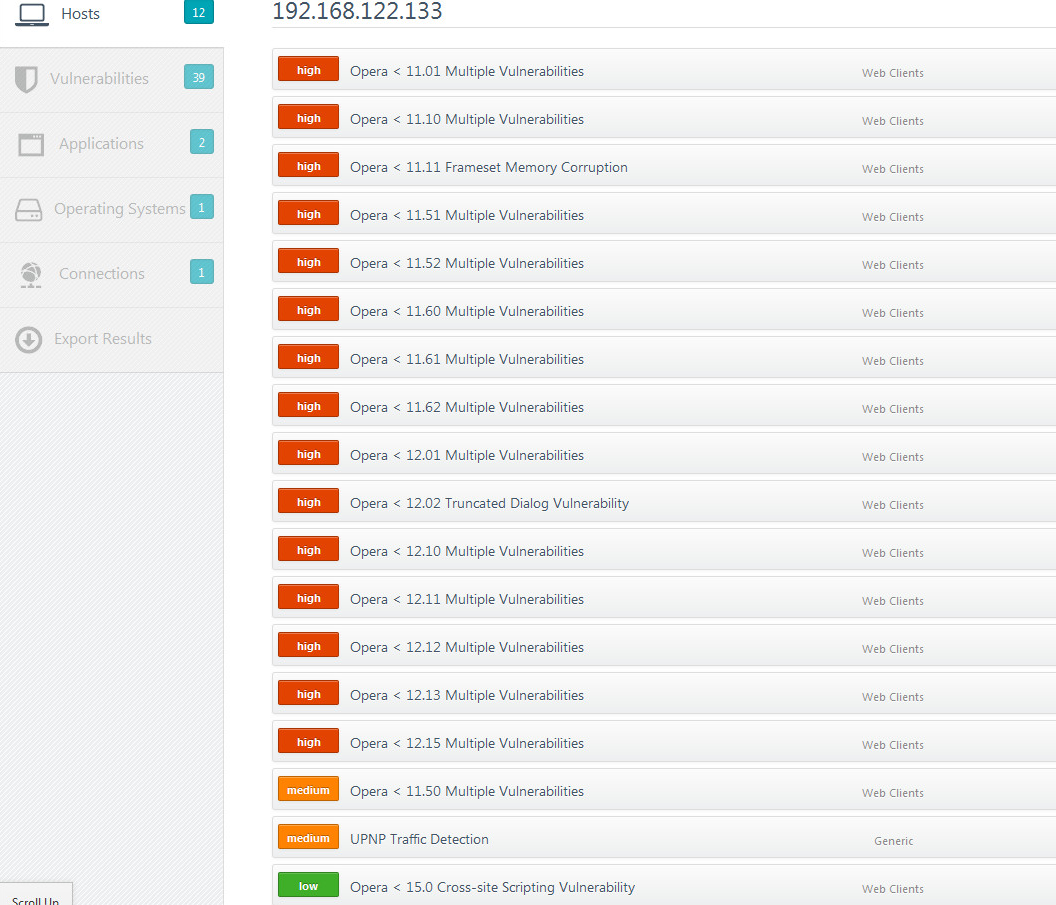
But then I fired up some internet functions on our TV, and immediately got a screen full of red. Not only is our TV running an old version of Opera, but it's got an XSS vulnerability! Oh, and it's also running UPNP (no surprise there). I think it's time to update my TV!
It also found the Flash versions on all hosts that had flash. This in itself is worth the price of admission on a corporate network! As time goes on, you'll see more and more applications that generate network traffic show up in the list.
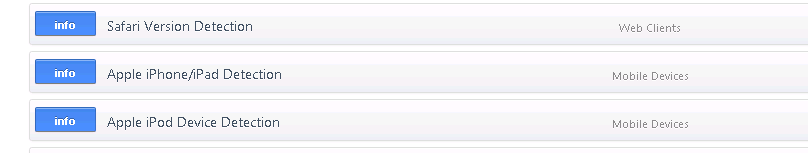
An interesting situation is that in the vulnerability page, PVS identifies all of our i-devices (and we have a bunch), but Apple IOS is not listed in the discovered Operating Systems page. It was nice to see that it could tell an iPod from an iPad. Each of these findings has more pages of detail behind it of course.
As in any scanner, there was one false positive. The DHCP server that I have running on my ASA Firewall was mis-identified as a vulnerable ISC DHCP server (from isc.org, not isc.sans.edu), but as with any scanner, system log or monitoring tool, you need to a/ look at the results and b/ apply some thought to the results, so a false positive here or there is much better than missing information entirely (false negatives).
The main "monitor" screen is a close to real-time display, with a short memory (you can configure the retention times). This is a good thing in a corporate environment, as mobile devices on a network today might be on a different network in an altogether different location tomorrow. There is a "results" tab that snapshots results at regular intervals (also configurable), so that you still have access to historical content.
While PVS found things on the network that p0f did not, the reverse is also true. The major difference for me was the data presentation. If you are short of time (which I think we all are), a colour coded display that lays everything out has a lot of value. On the other hand, if you need to get into the weeds, the logs from p0f provide a lot more detail than PVS graphical screens do. Mind you, the volume of raw data that comes with it makes weeding through the data a challenge, and until you get some scripts that suit your requirements it can take a lot of time.
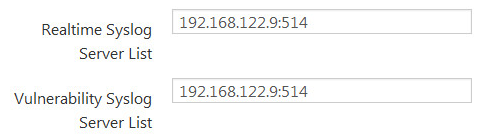
A final note - if you use PVS and are yearning for the hundreds or thousands of log entries per day that p0f would give you, you can configure PVS to cough up that raw data as well. More correctly, you can configure it to syslog it for you - there are separate settings for a "realtime syslog server list" and a "vulnerability syslog server list". An important note on these settings, just punching in your syslog server IPs into these fields will not work, you need to include the listening ports:
You can then parse your syslog entries for PVS data with "cat syslogdata.txt | grep PVS" (*nix) or "type syslogdata.txt | find PVS" (windows)
If you use a different passive scanning tool, or have found something *interesting* while running passive scans on your network, please share on our comment form
All in all, this was a fun little bake-off, I'll be leaving both products running on my home network long term. I hope you have as much fun installing one or both on your home network (or even better, your network at work) over the holdays!
===============
Rob VandenBrink
Metafore


Comments
HotLava PCI hex-port NIC on Ebay: $105.00
Intrusion Inc. or other comparable dual-port aggregator tap on Ebay: $150.00
5 reconfiguration hours /yr saved @ $50.00/hr: -$250
Less grief from significant other: pricele$$
Anonymous
Dec 19th 2013
1 decade ago
At my dayjob, we have a FireEye (a heavily overloaded one in one office), a PaloAlto Firewall, and a snort sensor and while there's a significant amount of overlap on what they find the things they find that don't overlap are also very interesting. The FireEye and the PaloAlto seem better at detecting a user downloading some piece of malware-du-jour than snort. Often the snort log just shows that some executable was downloaded. But on the other hand, snort seems much better at detecting malware that's phoning home or a system that's been compromised and is now being used to scan other systems (or other sorts of misbehavior).
That's not to say snort is "better" or "worse" than the FireEye or the PAFW. They all just use different mechanisms to detect things and I see them as complimentary. When I see a FireEye or PAFW alert about a system, I also check the snort logs for that IP and sometimes get more info there (what happened just before or just after the compromise - what else is the system doing now).
Only other thing I'd note is that it's easy to get "information overload" from these sorts of sensors. So be prepared to setup something to collate/fold/spindle/mutilate the data they find and turn it into action-items for your desktop/junior-admin crew. Otherwise you'll be spending all day, every day, pawing through 3 or 4 different web interfaces to see what's going on in your network. :-)
Anonymous
Dec 19th 2013
1 decade ago