Simulating Traffic With Scapy
It can be helpful to simulate different kinds of system activity. I had an instance where I wanted to generate logs to test a log forwarding agent. This agent was processing DNS logs. There are a variety of ways that I could have decided to simulate this activity:
- Generate the raw log file using a variety of tools including Bash, PowerShell, Python, etc
- Generate DNS traffic using a Bash script [1], Python script, etc
Since I'm always looking for another way to use Python, I decided to use a Python script to simulate the DNS traffic.
Sending Serially
To start out, I tested sending traffic to a host one request at a time, using a loop that would continue to send requests with Scapy [2] for three minutes.
import time, logging, sys
from scapy.all import *

basic_with_time_format = '%(asctime)s:%(levelname)s:%(name)s:%(filename)s:%(funcName)s:%(message)s'
stdout_handler = logging.StreamHandler(stream = sys.stdout)
stdout_handler.setFormatter(logging.Formatter(basic_with_time_format))
stdout_handler.setLevel(logging.INFO)

logging.root.addHandler(stdout_handler)
logging.root.setLevel(logging.INFO)

dst_ip = "192.168.68.1"
dst_port = 53
query = "testing.ignore"

dns_query = IP(dst=dst_ip)/UDP(dport=dst_port)/DNS(rd=1,qd=DNSQR(qname=query))

start_time = time.time()

send_count = 0
while (time.time() - start_time < 180):
    send(dns_query, verbose=False)
    send_count += 1

logging.info(f"Packets sent: {send_count}")
logging.info(f"Query rate of {send_count / (time.time() - start_time)}/second")


################# LOGGING OUTPUT #################
2024-08-28 21:15:36,216:INFO:root:dns_requests.py:<module>:Packets sent: 42614
2024-08-28 21:15:36,217:INFO:root:dns_requests.py:<module>:Query rate of 236.74056020138102/second
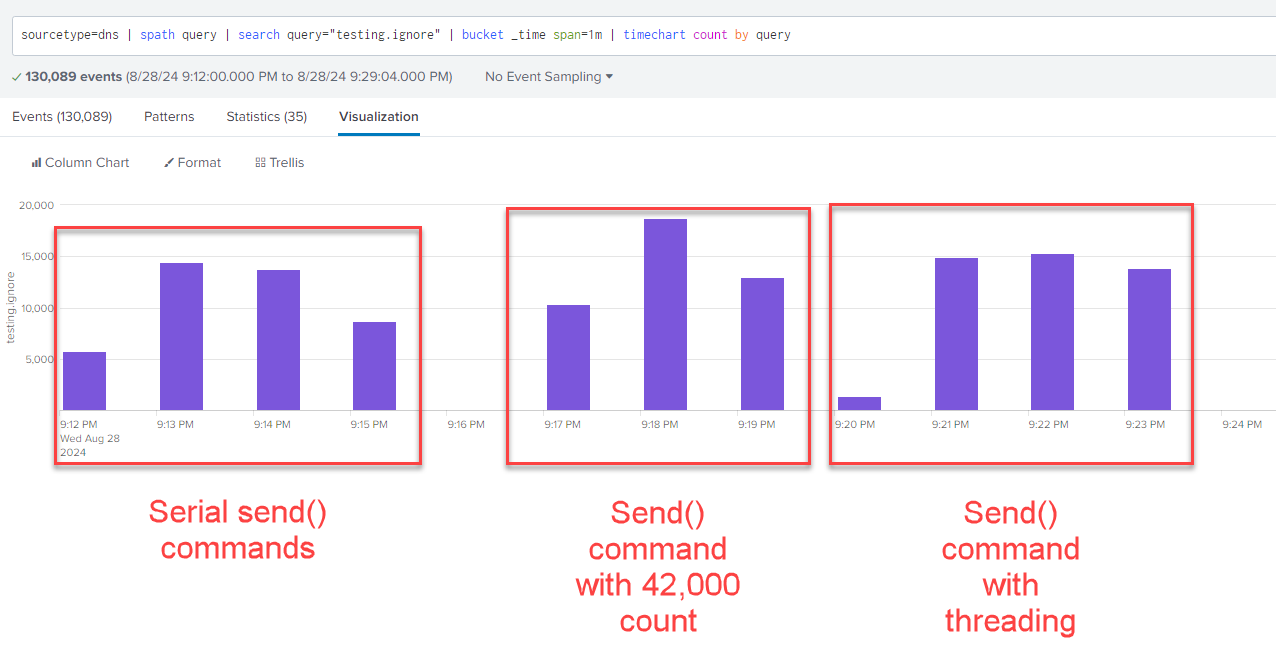
I was able to generate abour 42,000 requests, for a rate of about 236 requests per second. Not bad, but I wanted more. What other methods could I use to generate logs using Scapy to try and get a higher volume?
Sending Multiple Requests with Count
Next, I tried using Scapy with the "count" option. For this test I used 42,000 requests as a starting point and then measured the rate.
import time, logging, sys
from scapy.all import *

basic_with_time_format = '%(asctime)s:%(levelname)s:%(name)s:%(filename)s:%(funcName)s:%(message)s'
stdout_handler = logging.StreamHandler(stream = sys.stdout)
stdout_handler.setFormatter(logging.Formatter(basic_with_time_format))
stdout_handler.setLevel(logging.INFO)

logging.root.addHandler(stdout_handler)
logging.root.setLevel(logging.INFO)

dst_ip = "192.168.68.1"
dst_port = 53
query = "testing.ignore"

dns_query = IP(dst=dst_ip)/UDP(dport=dst_port)/DNS(rd=1,qd=DNSQR(qname=query))

start_time = time.time()

send_count = 0
send(dns_query, count=42000, verbose=False)

logging.info(f"Complete in {time.time() - start_time} seconds")
logging.info(f"Query rate of {42000 / (time.time() - start_time)}/second")


################# LOGGING OUTPUT #################
2024-08-28 21:19:40,956:INFO:root:dns_requests_count.py:<module>:Complete in 134.46240949630737 seconds
2024-08-28 21:19:40,957:INFO:root:dns_requests_count.py:<module>:Query rate of 312.35329612384174/second
This was able to give me about 312 reqeusts per second, which was a nice improvement over the previous test, approximately 32% more requests.
Sending Multiple Requests with Threading
What about using threading? Could this give me more request volume if I was able to send more data with less of a delay?
import time, logging, sys
from scapy.all import *
from concurrent.futures import ThreadPoolExecutor

basic_with_time_format = '%(asctime)s:%(levelname)s:%(name)s:%(filename)s:%(funcName)s:%(message)s'
stdout_handler = logging.StreamHandler(stream = sys.stdout)
stdout_handler.setFormatter(logging.Formatter(basic_with_time_format))
stdout_handler.setLevel(logging.INFO)

logging.root.addHandler(stdout_handler)
logging.root.setLevel(logging.INFO)

dst_ip = "192.168.68.1"
dst_port = 53
query = "testing.ignore"

dns_query = IP(dst=dst_ip)/UDP(dport=dst_port)/DNS(rd=1,qd=DNSQR(qname=query))

start_time = time.time()

send_count = 0
runner = ThreadPoolExecutor()
queries = []
while (time.time() - start_time < 180):
    queries.append(runner.submit(send, dns_query, verbose=False))
    send_count += 1


done = False
while not done:
    number_not_complete = 0
    for each_query in queries:
        if each_query.done() == False:
            number_not_complete += 1
            logging.debug(f"State: {each_query._state} left")
    if number_not_complete == 0:
        done = True
        logging.info(f"Processing completed. {number_not_complete} left")
    else:
        logging.info(f"Processing not yet completed. {number_not_complete} left")
    time.sleep(1)

logging.info(f"Packets sent: {send_count}")
logging.info(f"Seconds elapsed: {time.time() - start_time}")
logging.info(f"Query rate of {send_count / (time.time() - start_time)}/second")


################# LOGGING OUTPUT #################
2024-08-28 21:23:54,199:INFO:root:dns_request_threaded.py:<module>:Processing not yet completed. 278 left
2024-08-28 21:23:55,372:INFO:root:dns_request_threaded.py:<module>:Processing not yet completed. 24 left
2024-08-28 21:23:56,546:INFO:root:dns_request_threaded.py:<module>:Processing completed. 0 left
2024-08-28 21:23:57,547:INFO:root:dns_request_threaded.py:<module>:Packets sent: 45475
2024-08-28 21:23:57,548:INFO:root:dns_request_threaded.py:<module>:Seconds elapsed: 183.54532933235168
2024-08-28 21:23:57,549:INFO:root:dns_request_threaded.py:<module>:Query rate of 247.75896049992585/second
This gave me about 247 requests per second. A little faster than my first test, but not quite as much as using the "count" option.
Figure 1: Traffic volume comparisons with different Scapy options.
Scapy sendp() or send()?
I still want more volume. What else could I test? There are multiple functions that can be used to send data with Scapy, including send() and sendp() [3]. Sendp() requires some additional configuration since it isn't handling some of the routing features that send() would be. Would manually configuring options and offsetting some of the routing with help with volume?
First, I neded to some information to properly configure my data submissions. I needed to get my interface name.
>>> conf.iface
<NetworkInterface_Win Intel(R) Wi-Fi 6E AX210 160MHz [UP+RUNNING+WIRELESS+OK]>
With this new data in hand, I tried my new test, adding an Ethernet header and my interface.
import time, logging, sys
from scapy.all import *

basic_with_time_format = '%(asctime)s:%(levelname)s:%(name)s:%(filename)s:%(funcName)s:%(message)s'
stdout_handler = logging.StreamHandler(stream = sys.stdout)
stdout_handler.setFormatter(logging.Formatter(basic_with_time_format))
stdout_handler.setLevel(logging.INFO)

logging.root.addHandler(stdout_handler)
logging.root.setLevel(logging.INFO)

dst_ip = "192.168.68.1"
dst_port = 53
query = "testing.ignore"
interface = "Intel(R) Wi-Fi 6E AX210 160MHz"

dns_query = Ether()/IP(dst=dst_ip)/UDP(dport=dst_port)/DNS(rd=1,qd=DNSQR(qname=query))

start_time = time.time()

send_count = 0
sendp(dns_query, count=42000, verbose=False, iface=interface)

logging.info(f"Complete in {time.time() - start_time} seconds")
logging.info(f"Query rate of {42000 / (time.time() - start_time)}/second")


################# LOGGING OUTPUT #################
2024-08-28 22:09:09,894:INFO:root:<stdin>:<module>:Complete in 41.14687180519104 seconds
2024-08-28 22:09:09,894:INFO:root:<stdin>:<module>:Query rate of 1020.7337315664743/second
I was able to achieve a rate of about 1021 requests per second. Over three times the volume from previous tests.
| Scapy Sending Method | Option(s) | Sending Rate |
|---|---|---|
| send() | 236.74 queries/second | |
| send() | count=42000 | 312.35 queries/second |
| send() | threading | 247.76 queries/second |
| sendp() | count=42000 | 1020.73 queries/second |
Figure 2: Volume rate comparisons with different scapy options and methods.
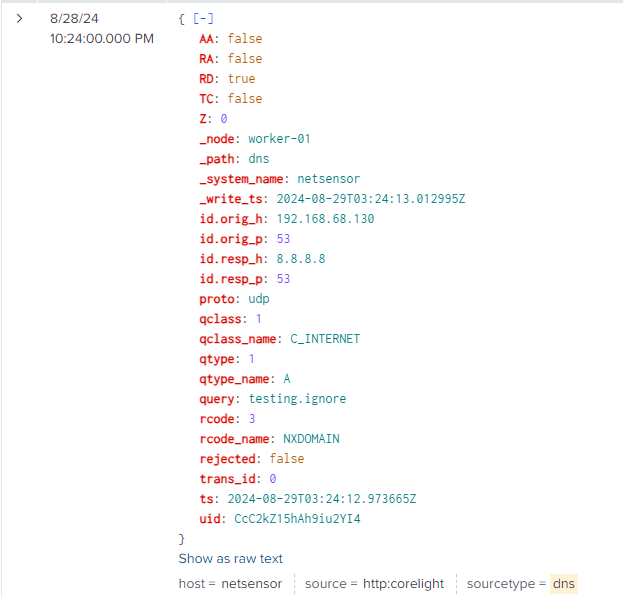
Since I wanted to make sure that everything was working correctly, I decided to update my script to send one request with sendp() to an external resolver.
################## EXCERPT ##################

dst_ip = "8.8.8[.]8"
dst_port = 53
query = "testing.ignore"
interface = "Intel(R) Wi-Fi 6E AX210 160MHz"

dns_query = Ether()/IP(dst=dst_ip)/UDP(dport=dst_port)/DNS(rd=1,qd=DNSQR(qname=query))
sendp(dns_query, iface=interface)

################## EXCERPT ##################
Figure 3: DNS "NXDOMAIN" response for "testing.ignore", confirming sendp() worked.
There are still many other ways to replicate DNS activity and log generation. A good option is simply recording previous sessions in a PCAP and playing them back [3]. Creating the local log file, rather than having the DNS service create the log file, would probably allow for a higher logging volume. It would eliminate any bottlenecks of the DNS service or the device(s) sending the requests. However, replicating the DNS traffic also helped in testing the DNS server in addition to the logging agent. Another benefit of this option is that Zeek [4] data was available to validate the traffic, volume and responses.
Do you have another way you would have done this stress testing? Let me know!
[1] https://www.reddit.com/r/networking/comments/k8tdj7/dns_traffic_generator/
[2] https://scapy.net/
[3] https://scapy.readthedocs.io/en/latest/usage.html
[4] https://zeek.org/
--
Jesse La Grew
Handler


Comments