A few Ghidra tips for IDA users, part 4 - function call graphs
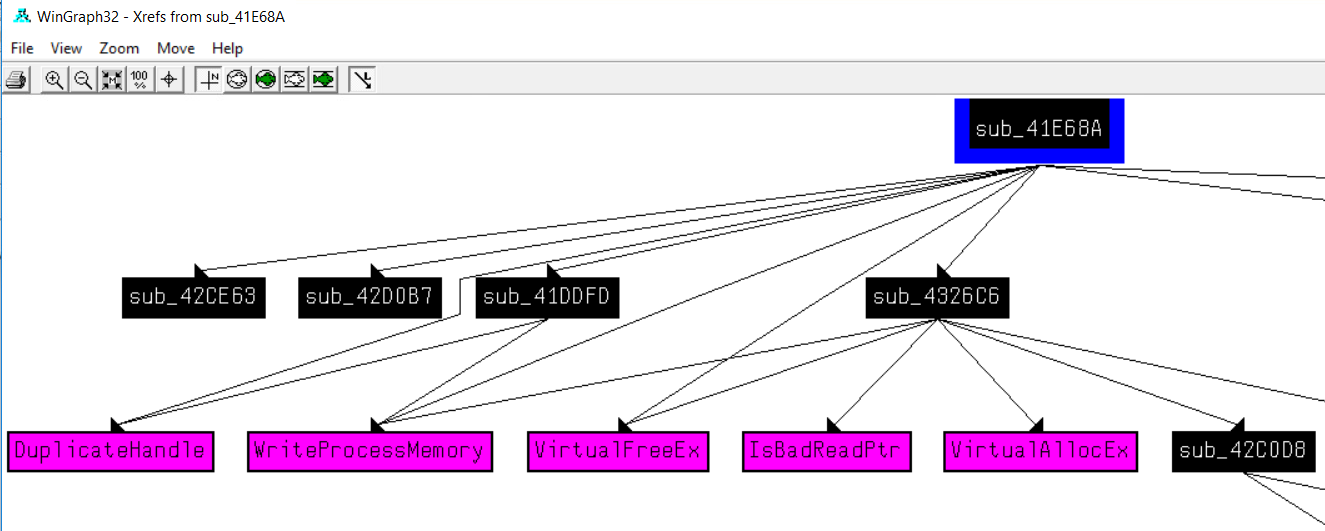
One of the features of IDA that we use in FOR610 that can be helpful for detecting malicious patterns of API calls is the feature for creating a graph of all function calls called from the current function and any functions that it calls. The graph itself isn't all that pretty to look at, but it allows us to see if all the APIs in a particular pattern (code injection, for example) are made in the proper order. We do this by choosing View > Graphs > 'Xrefs from' in the menus. In IDA, it looks like the following.
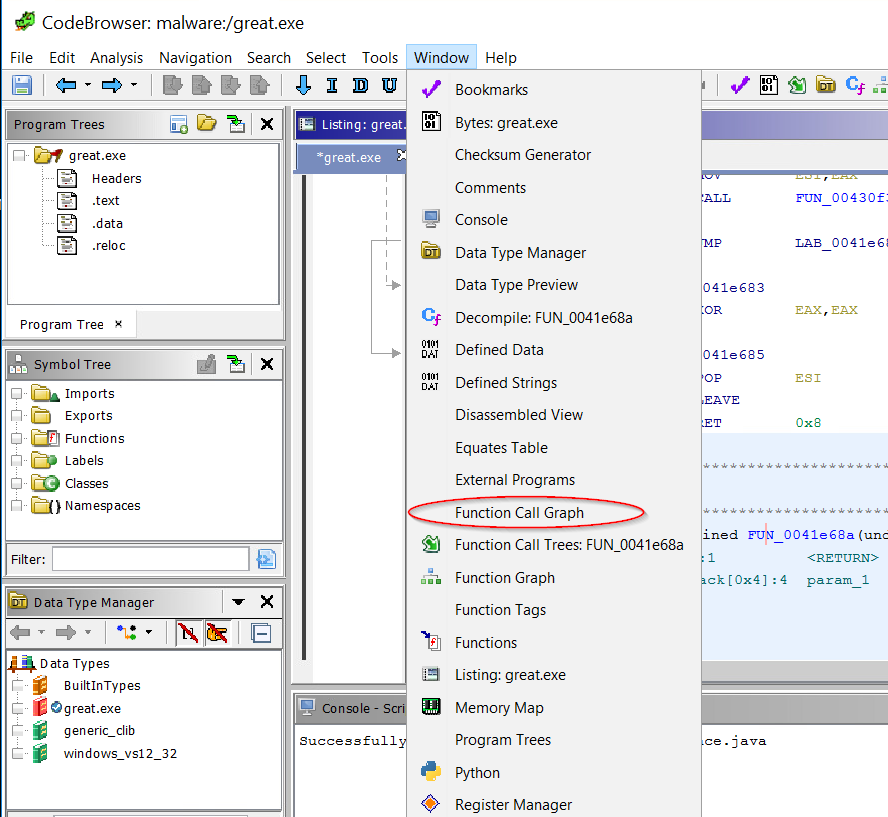
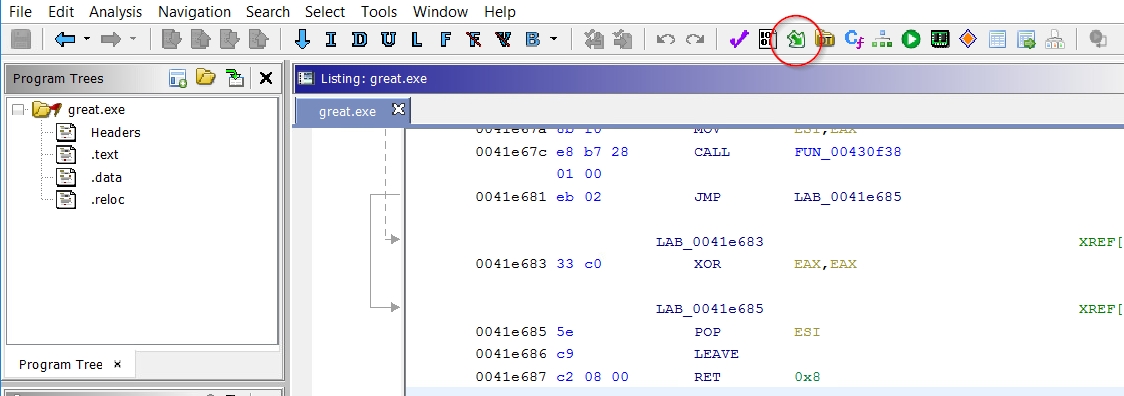
When I first went looking for an equivalent in Ghidra, I had a hard time finding it. I eventually found it in the Window menu.
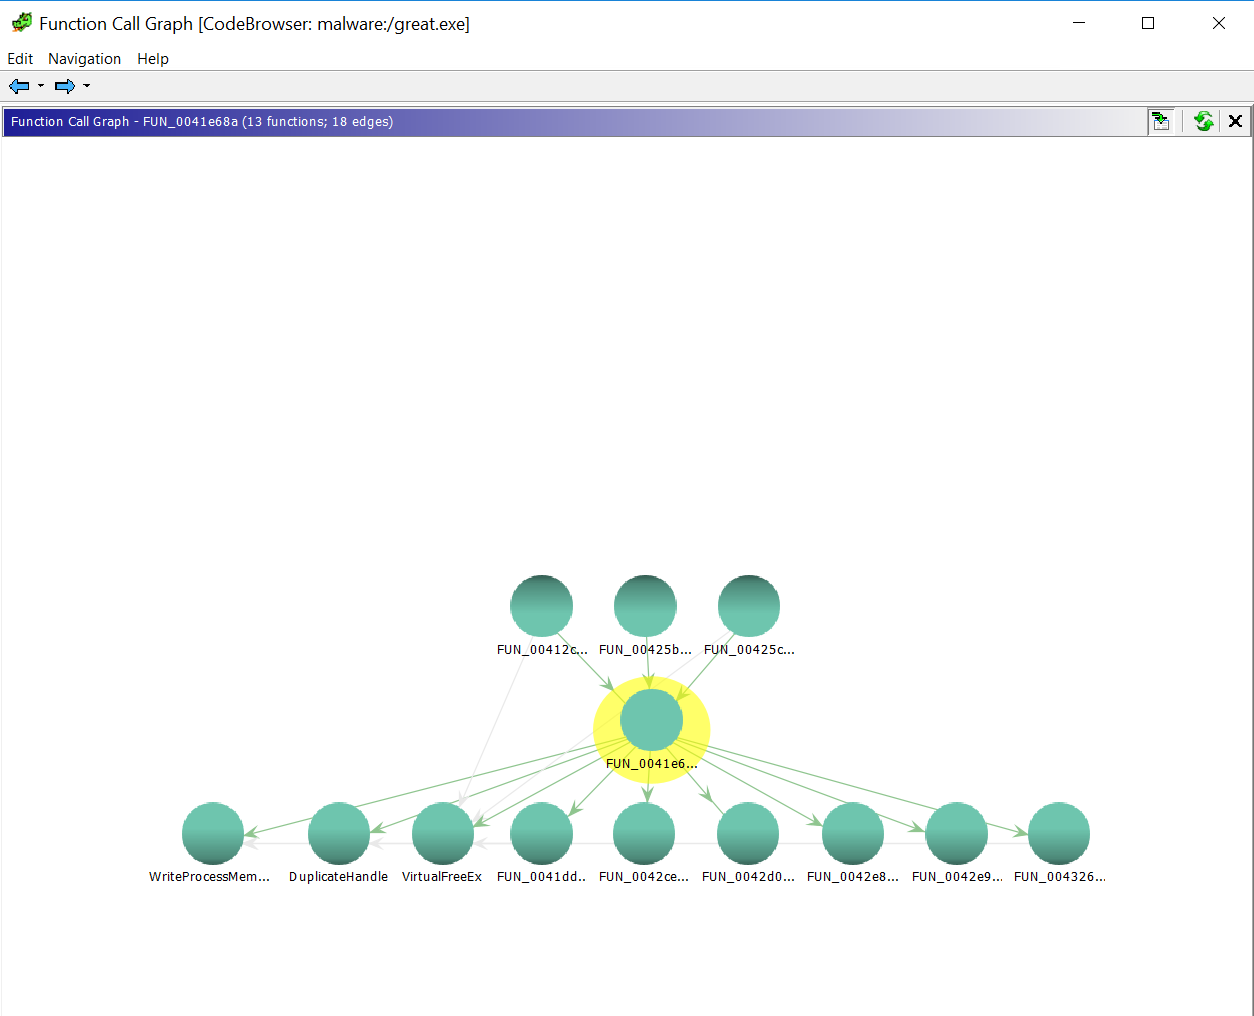
But, when I first ran it, I only saw the functions that call this one (which is nice, you need to do Xrefs to in IDA to see these) and the ones that this function called, so only 1 level deep in each direction. That wasn't going to cut it because sometimes the API calls that we're interested in are buried several levels of calls deep.
However, after looking at it for a while, I discovered that if you right-click on any node in the bottom row, you get a menu that allows you to extend it another level deeper, by selecting 'Show Outgoing Level Edges'. Okay, this is promising.
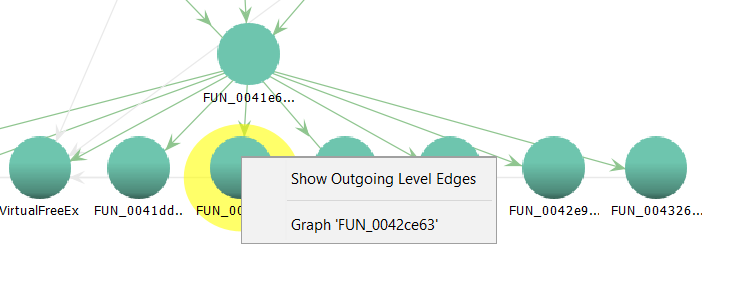
After selecting that, I got the following
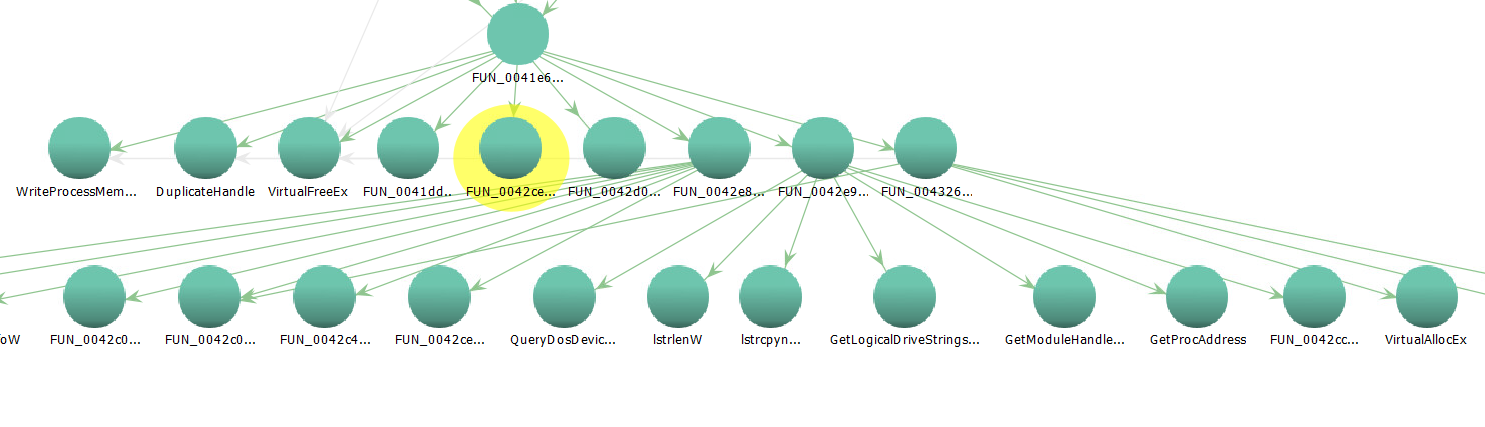
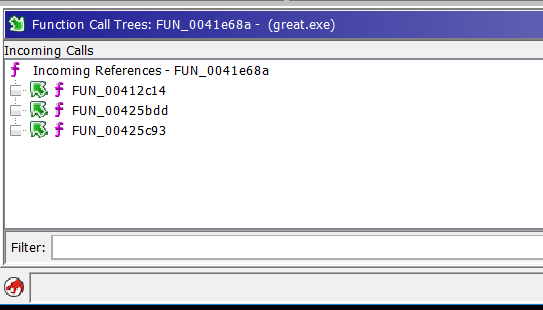
Those lines are still somewhat confusing, but you can move the individual nodes in the graph around to make the relationships clearer. Also, have I mentioned how nice a big monitor is when you are reversing (in either IDA or Ghidra). And, since you have the control to expand one level at a time, I may even come to like this more than IDA's graph. If the graphs are somewhat confusing to you, though, you can also use the Show Function Call Tree button to bring up a couple of pains that show the same info textually
On the left side are the incoming calls
And on the right, the outgoing calls.
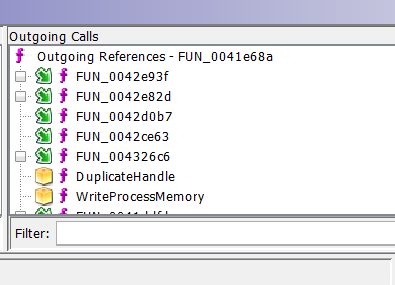
And you can then expand any of the functions which may call other functions (those with the little box in front)
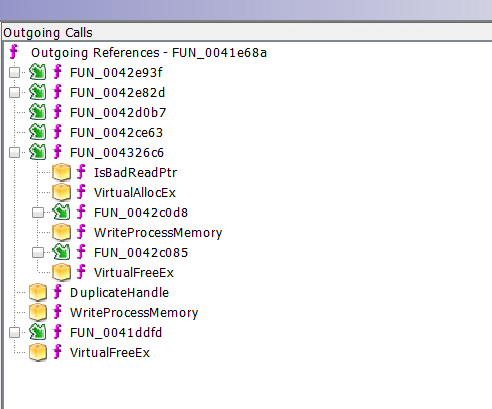
For me, personally, that may work even better, but you may prefer the graph.
I think I'll wrap up this entry here. If you are at SANSFIRE next week, please come to the SANS ISC annual State of the Internet panel on Monday evening in Salon 1. You can also stop by and say 'Hi!' I'll be TA-ing for Lenny Zeltser in FOR610. As with all the other entries in the series if you have other thoughts or tips, feel free to comment here, send me an e-mail, or drop into our slack channel. Until next time, ...
---------------
Jim Clausing, GIAC GSE #26
jclausing --at-- isc [dot] sans (dot) edu


Comments