System Resource Utilization Monitor
The attackers have come and gone and you are left behind to clean up the mess. You arrive on site to figure out how the bad guys got in, what they took and how badly it will affect the customer. But, the customer doesn't syslog the firewall logs, so you are limited to the three days of logs that are held in the firewall's memory. The Windows Event logs on most of the systems roll over every 5 minutes, and there is no centralized long term logging. There is no IDS. There is no full packet capture. They have removed the malware used by the attacker, deleted the attacker's accounts, removed the compromised software and reinstalled the latest version of software. For good measure, they also installed a years' worth of OS and software patches that were missing. Being a glutton for punishment you ask if you can take the compromised server offline to create a forensics image but you are told management wants to "tread lightly" on the server. "That’s Ironic" goes through your mind but doesn't cross your lips. No logs. No obvious forensic artifacts. The only clues left are the remains of whatever wasn't stomped on by the administrators overzealous premature clean up.
Despite the customer's unintentional efforts to destroy the last remnants of proof the attackers, within a few minutes you can have a pretty good idea of what the attackers did. After the attacker created a new account on the system they logged in using RDP. They downloaded and executed additional malware on the victim's machine launching attacks on neighboring systems. After collecting up their loot, they connected to a nearby open Wi-Fi to bypass your egress monitoring and transferred the stolen database over the open WI-FI. All of these attacker actions are discoverable without doing a full forensics timeline by looking at a little-known log of all users' activity on the system called SRUM.
The Windows System Resource Usage Monitor (aka SRUM) contains a wealth of information about all the activities that occur on your machine. Some of this information is visible from the "APP HISTORY" tab on the task manager, but a vast amount of detail collected is not displayed via the GUI. It keeps the names and paths of every application that executes on your system even the ones the attackers deleted. It records the user's SID that execute the program so we knew the attacker used a temporary account that the administrators clean up deleted. It records then names of all of the networks you have connected to and how long you were connected. It also records application battery usage, CPU time broken down by foreground and background time, how many bytes were written and read from the hard drive by the application and much more. The information is stored in the \Windows\System32\sru\ directory in a file named SRUDB.DAT. The file is in the Windows ESE (Extensible Storage Engine) database format. So the trick is to get the data out and make sense of it.
Ovie Carrol was telling me how invaluable the data was in one of his investigations. An excellent paper on the internals of the database by Yogesh Khatri is available in the SANS reading room. But unless you have Encase you can't access the data using his scripts. I wrote a small program called srum-dump.exe that will extract the data so you can view it using Microsoft Excel or any XLSX compatible viewer.
SRUM-DUMP will accept a few inputs. One required input is the SRUDB.DAT file from a system you want to analyze. Another required input is an EXCEL file that specifies which fields you want to extract and what format you want them in. I provide a sample template along with the program on my GITHUB called SRUM-TEMPLATE.XLSX. You can optionally provide a copy of the SOFTWARE registry hive which is typically located in the \Windows\System32\config\ directory if you want to resolve the names (SSID) of Wireless networks. SRUM-DUMP reads the SRUDB.DAT file, extracts it as defined in the SRUM-TEMPLATE.XLSX file and produces a new XLSX file with the results.
For example. The following will analyze the input (-i) SRUDB.DAT, the registry (-r) SOFTWARE and create an output file (-o) called example_output.xlsx. The -t option can be used to specify a template file. If no template is specified it will use SRUM-TEMPLATE.XLSX in the same directory as srum-dump.exe.
C:\srum-dump>srum_dump.exe -i ..\SRUDB.dat -r ..\SOFTWARE -o ..\example_output.xlsx
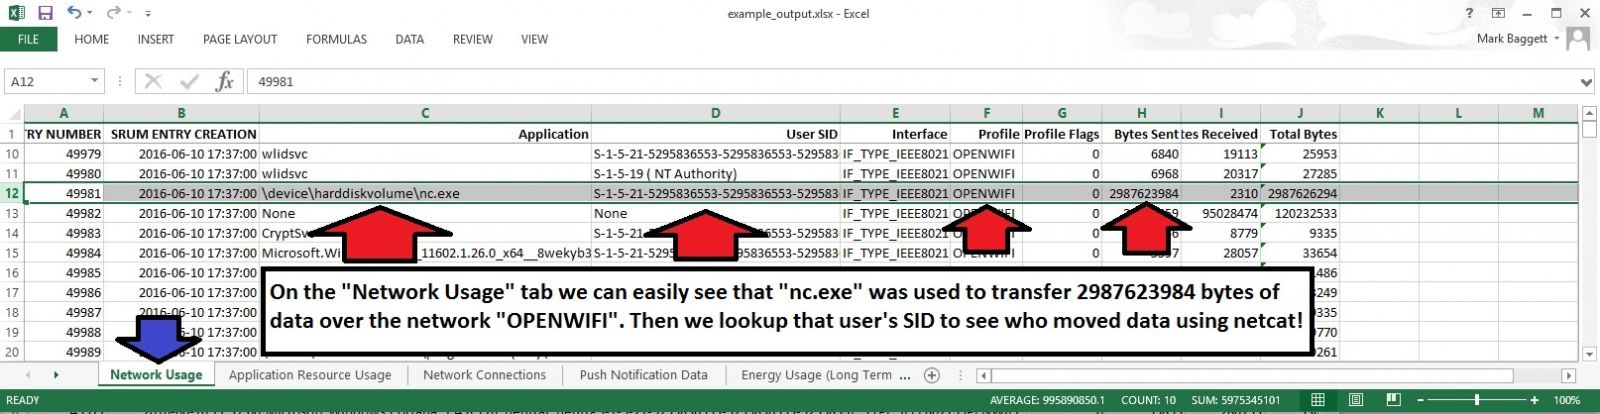
The resulting XLSX file has multiple tabs across the bottom. Each tab is filled with useful information. In this screenshot, you can see that on the Network Usage tab that NC.EXE was used to transfer a large amount of data over a wireless network named "OPENWIFI". You also have the SID of the user who ran netcat.
And that is just from one tab!. There is a lot more information you can get from the spreadsheet. You can customize the data that is retrieved from the database by modifying the SRUM_TEMPLATE.XLSX file to meet your needs. The artifacts that are recoverable from the SRUM can change they way you do incident response!. Download a copy and give it a try. The README on the github site has more information to get you started.
Download a copy of srum-dump.exe from here: https://github.com/MarkBaggett/srum-dump
For more information on SRUM and other useful forensic artifacts check out SANS FOR408 Windows Forensics Analysis.
If you would like to add new features to SRUM-DUMP or develop similar programs check out SANS SEC573 Automating Information Security with Python.
There are two opportunities to take the Python course from me in the near future.
Come see me in London or come see me in Orlando Florida at SANS 2017
Follow me on twitter @MarkBaggett
Some tools updates
A couple of tools were updated and release today.
Network Miner was updated. Version 2.1 is not available for download. Network Miner is packet sniffer/analyzer focused on extracting application layer forensic artifacts. The update adds new protocols and enhances email reassembly options.
http://www.netresec.com/?page=Blog&month=2017-01&post=NetworkMiner-2-1-Released
Blackhills Information Security released a Powershell version of the DNSCAT2 client. DNSCAT2 is a popular command and control tool that uses the DNS infrastructure to control hosts inside a tightly filtered perimeter. This new DNSCAT2 client is a Powershell implementation of the popular tool and will certainly be a hit with penetration testers.


Comments